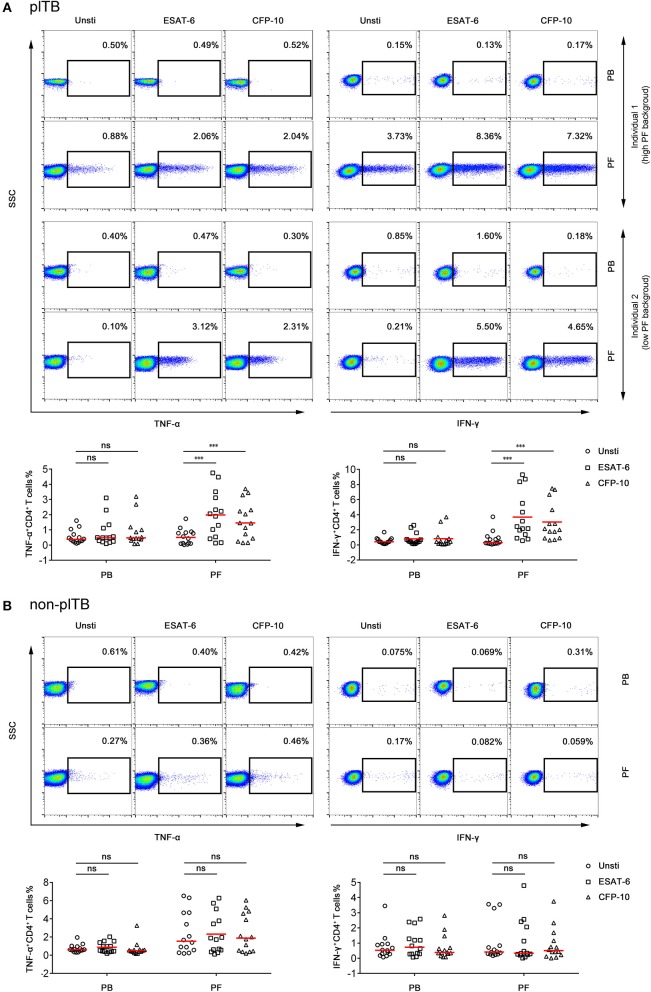
Figure 4.
The frequency of Mtb-specific CD4+ T cells in PB and PF. PBMCs and PFMCs separated from plTB and non-plTB patients were stimulated with ESAT-6 and CFP-10 for 24 h. (A) Representative FACS plots showing the expression of TNF-α and IFN-γ in CD4+ cells in plTB patients. Individual 1 represents a high background patient and individual 2 represents a low background patient. The percentages of TNF-α+ and IFN-γ+ cells in CD4+ cells are shown. Horizontal lines indicate the median. (B) Representative FACS plots showing the expression of TNF-α and IFN-γ in CD4+ cells in non-plTB patients. The percentages of TNF-α+ and IFN-γ+ cells in CD4+ cells are shown. Horizontal lines indicate the median. ***P < 0.001; ns, no significance (Mann–Whitney U-test). PB, peripheral blood; PF, pleural fluid; plTB, pleural tuberculosis; Unsti, unstimulation; ESAT-6, early secreted antigenic target 6; CFP-10, culture filtrate protein 10.

