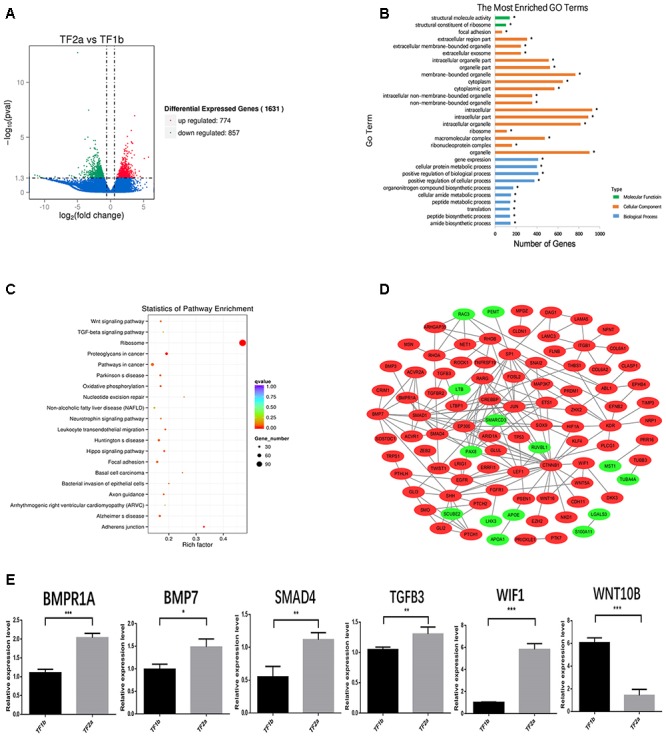
Figure 2.

The outcome of bioinformatics analyses of RNA sequencing data of sheepskin with qRT-PCR validation. (A) Volcano plot displaying the mRNA transcripts enriched between stage TF2a and stage TF1b of the prenatal sheepskin. The DEGs were enriched to compare the budding stage (TF2a) with the pre-gland stage (TF1b) of apocrine sweat glands in coarse wool sheepskin (n = 3) as shown in the volcano plot. There were 1631 differentially expressed transcripts, including 774 upregulated (right, red) and 857 downregulated (left, green), between these two groups. The criteria set up for the enrichment are | log2 (fold change) | > 1 and P value (P < 0.05); (B) The top 20 GO terms are presented in the enrichment analyses of differentially expressed mRNA transcripts between apocrine sweat gland induction stages (TF2a vs. TF1b) in coarse wool sheepskin. A total of 786 terms were significantly enriched (P < 0.05) in the categories of biological process (blue), molecular function (green), and cellular components (yellow red). (C) The top 20 KEGG pathways are displayed in the enrichment analyses of differentially expressed mRNA transcripts in apocrine sweat gland stages (TF2a vs. TF1b) in coarse wool sheepskin. The top 20 out of 248 terms of differently expressed mRNA transcripts were grouped and displayed (P < 0.05). Of those, three signaling pathways (WNT, TGF-β, and Hippo signaling pathways), focal adhesion and adherent junctions were potentially involved in histological changes during the morphogenesis of apocrine sweat gland (TF2a vs. TF1b) in coarse wool sheepskin. (D) The mRNA–mRNA interaction networks were constructed by using the potential candidate genes involved in the development of skin, wool follicles and glands. The WNT, TGF-beta, and SHH signaling pathways were clearly grouped. Another two groups networked by KDR and ITGB1 were potentially involved in basement membrane and cell proliferation. (E) A total of 6 DEGs were selected for quantitative real-time PCR (qRT-PCR) validation. The expression patterns of BMP1A, BMP7, SMAD4, TGFB3, WIF1, and WNT10B are consistent with the tendency of mRNA sequencing results by using the 2-ΔΔCt method and GAPDH as internal control. Data are presented as mean ± SD (n ≥ 3). ∗P < 0.05, ∗∗P < 0.01 ∗∗∗P < 0.001 (Student’s t-test).
