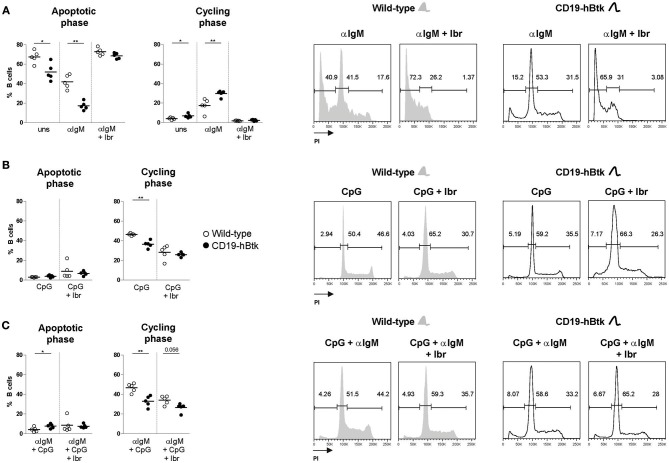
Figure 2.
BCR and TLR9 stimulation have different effects on CD19-hBtk B cells. Proportions of B cells in apoptotic or cycling fractions, as determined by propidium iodide (PI) DNA content staining of in vitro cultured purified naïve splenic B cells that were stimulated with 10 μg αIgM (A), 2 μM CpG (B), or αIgM and CpG combined (C), with or without ibrutinib (Ibr, 1 μM) as indicated (left). Symbols represent individual mice and bars indicate mean values. Representative flow cytometry graphs of WT and CD19-hBtk B cells are shown on the right, with the gating applied for apoptotic cells (sub-G1), resting cells (G0/G1), and dividing (S/G2/M) B cells. CD19-hBtk and WT mice were 8–10 weeks old; n = 4–5 per group; *p < 0.05, **p < 0.01 by Mann–Whitney U-test.

