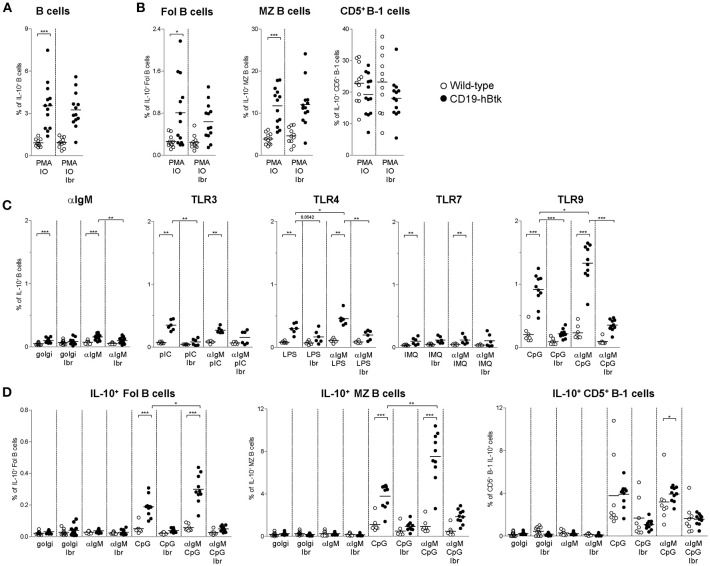
Figure 4.
Increased IL-10 expression following synergistic BCR and TLR9 stimulation of CD19-hBtk B cells. (A,B) Proportions of IL-10-expressing B cells after 4 h of in vitro stimulation of total splenocytes from the indicated mice with PMA/ionomycin in the presence of monensin (golgi), as determined by intracellular flow cytometry. Shown are data for gated total CD19+B220+CD3− B cells (A), or for gated B cell subpopulations (B), as indicated: follicular (Fol) B cells, marginal zone (MZ) B cells and CD5+ B-1 cells. (C) Proportions of IL-10-expressing B cells after 4 h of in vitro stimulation of total splenocytes from the indicated mice with αIgM, the indicated TLR ligands, or combinations thereof in the presence of monensin (golgi), as determined by intracellular flow cytometry. (D) Proportions of IL-10-expressing B cells after 4 h of in vitro stimulation of total splenocytes from the indicated mice with αIgM (αIgM), CpG, or combinations thereof, with or without ibrutinib (Ibr, 1 μM), in the presence of monensin (golgi), as determined by intracellular flow cytometry. CD19-hBtk and WT mice were 28–33 weeks old. Symbols represent individual mice and bars indicate mean values. Graphs represent two to three individual experiments; *p < 0.05, **p < 0.01, ***p < 0.001 by Mann–Whitney U-test.

