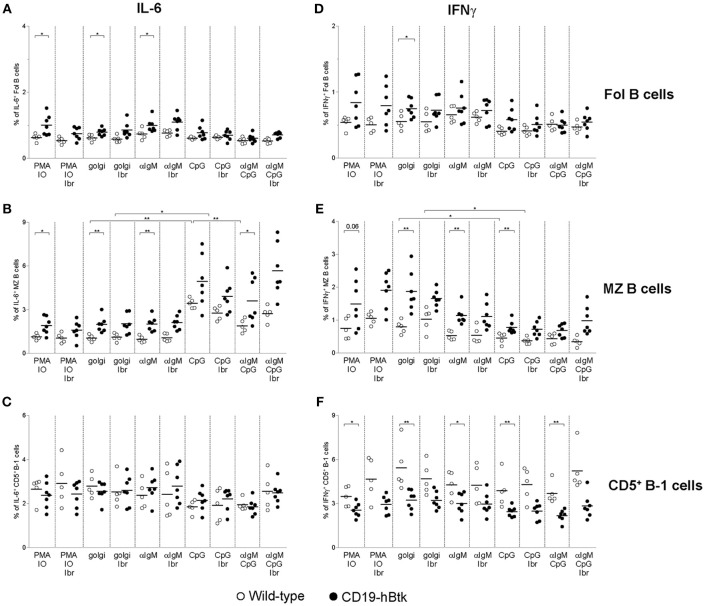
Figure 5.
Analysis of IL-6 and IFNγ expression in B cell subsets from CD19-hBtk B cells. Proportions of IL-6+ (A–C) and IFNγ+ (D–F) B cells upon stimulation with the indicated stimuli, with or without ibrutinib (Ibr, 1 μM) in the presence of monensin (golgi), within gated B cell subsets: follicular (Fol) B cells (A,D), MZ B cells (B,E), and CD5+ B-1 cells (C,F). CD19-hBtk and WT mice were 28–33 weeks old. Symbols represent individual mice and bars indicate mean values. Graphs are representative for one to two individual experiments; *p < 0.05, **p < 0.01 by Mann–Whitney U-test.

