Figure 6.
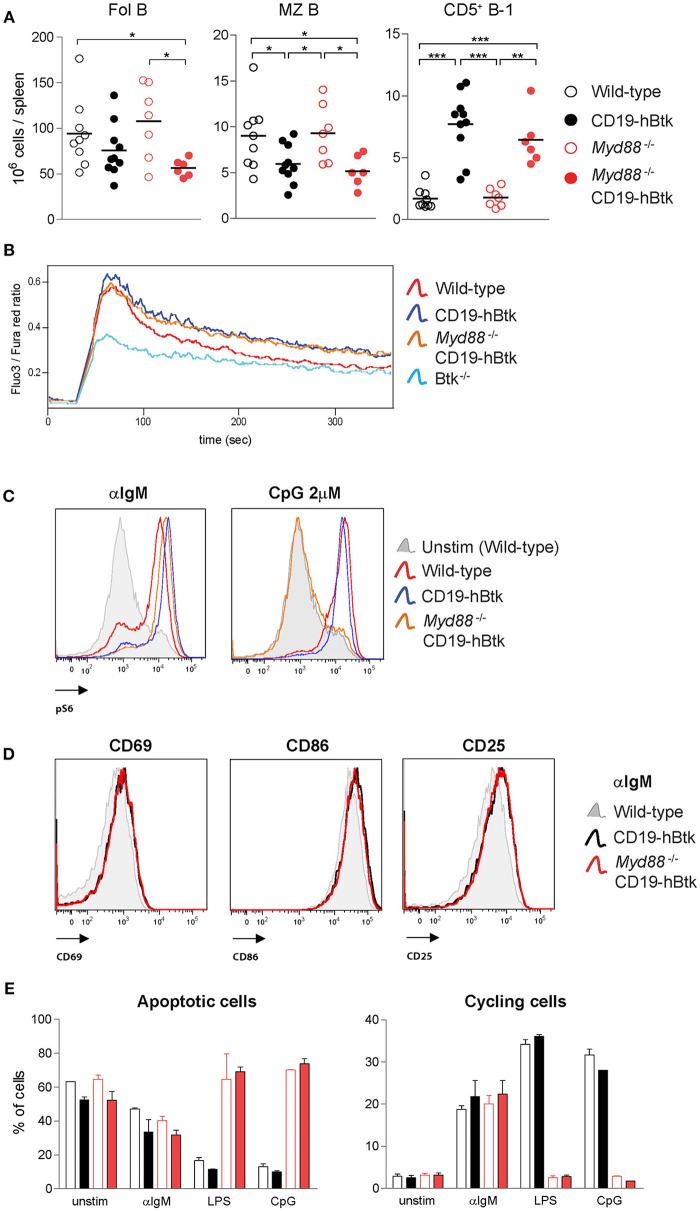
Increased BCR responsiveness in CD19-hBtk B cells is independent of MyD88 expression. (A) Quantification of the absolute numbers of Fol B cells (CD19+CD21−CD23+), MZ B cells (CD19+CD21+CD23−), and CD5+ B-1 cells (CD19highB220intCD5+) in spleens from the indicated aged mice. (B) Ca2+ influx assay in B cells after stimulation with 25 μg F(ab')2 anti-IgM in the indicated mouse groups. Data are representative for three mice analyzed. (C) Representative histogram overlays of phosphorylated S6 (pS6) upon 20 μg/mL αIgM or 2 μM CpG stimulation in the indicated mouse groups. Data are representative for two to three mice analyzed. (D) Representative histogram overlays of the expression of activation markers CD69, CD86, and CD25 in Myd88−/− CD19-hBtk (red), CD19-hBtk (black), and WT mice (gray). Data are representative for two mice analyzed. (E) Proportions of B cells in apoptotic (left) or cycling (right) fractions, as determined by PI staining for DNA content, after 2 days of in vitro stimulation with the indicated stimuli. CD19-hBtk and WT mice were 28–33 weeks old (A) or eight weeks old (B–E). Data (mean values + SD) represent one to three individual experiments; *p < 0.05, **p < 0.01, ***p < 0.001 by Mann–Whitney U-test.

