
Figure 2.
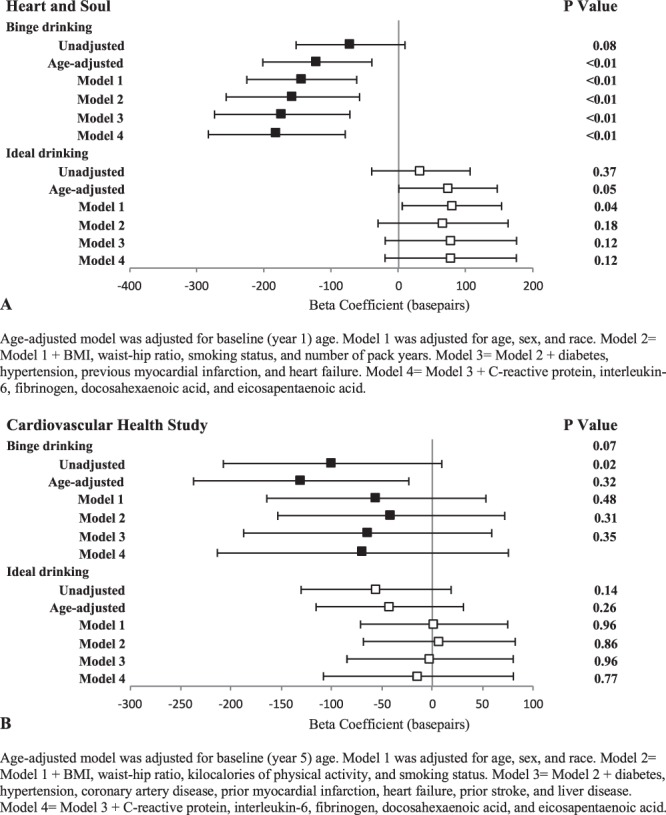
Associations of binge drinking (black square) and ideal drinking (white square) with baseline telomere length. See methods for classification of binge and ideal drinking. Y error bars denote 95% confidence intervals.
Official websites use .gov
A
.gov website belongs to an official
government organization in the United States.
Secure .gov websites use HTTPS
A lock (
) or https:// means you've safely
connected to the .gov website. Share sensitive
information only on official, secure websites.
Associations of binge drinking (black square) and ideal drinking (white square) with baseline telomere length. See methods for classification of binge and ideal drinking. Y error bars denote 95% confidence intervals.