Figure 6.
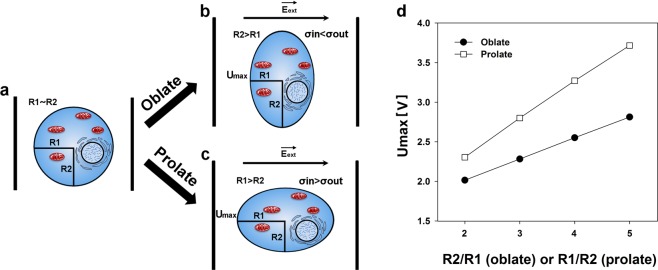
Graphical representation of cell deformation impact on electroporation. (a) Shows the cell before the application of electric field. Cell radius parallel to the direction of electric field (R1) is approximately equal to the cell radius perpendicular to the direction of electric field (R2). During the application of electric fields, R1 will become lower than R2 (oblate shape) if medium conductivity is higher in extracellular medium in comparison to the cytoplasm (σin < σout) (b). Similarly, R1 will become larger than R2 (prolate shape) if medium conductivity is lower in extracellular medium in comparison to the cytoplasm(σin > σout) (c). In both of these cases, the cross-section area would remain spherical. This deformation is caused by Maxwell stress and the effect of tangential electrical field. Due to this, area affected by electric field affected will become larger in oblate cell, and smaller in prolate cell. (d) Shows the maximum induced transmembrane potential (induced transmembrane potential at cell poles) on a 9.7 µm radius cell, deformed and electroporated by a single 1200 V/cm electric pulse. It can be seen that for the same deformation degree, the prolate spheroids always have higher maximum induced transmembrane potential than the oblate spheroids.

