
Figure 7.
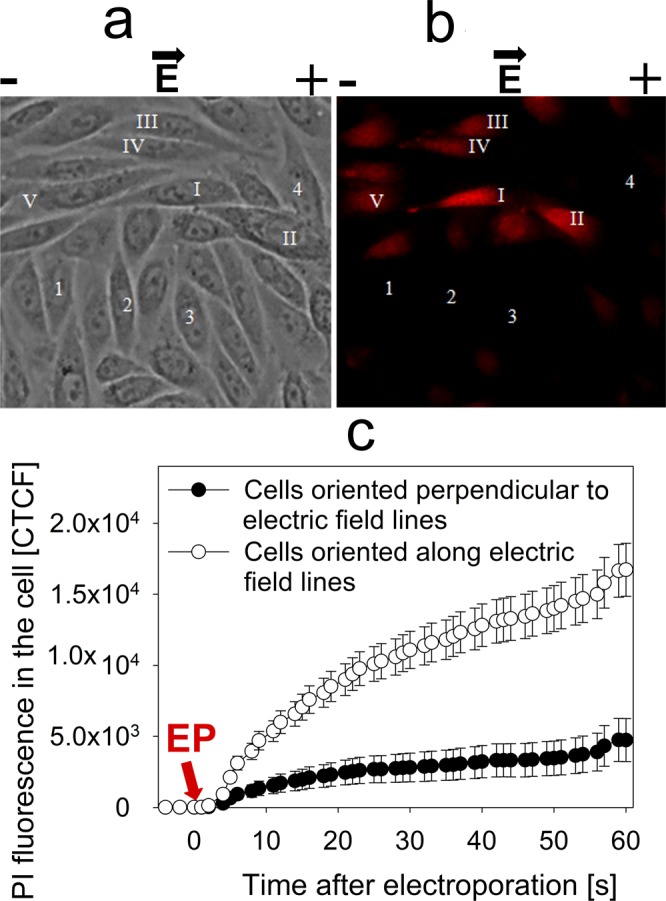
Fluorescence intensity of adherent cells oriented perpendicular and along the electric field lines, visualized under fluorescent microscopy. (a) Shows cells before the application of electric field, (b) shows the same cells after the application of electric field. It can be visually observed that cell fluorescence is higher in cells oriented along the electric field lines (I-V) in comparison to the cells oriented perpendicular to the electric field lines (1–4). These results are numerically represented in (c), where corrected total cell fluorescence was calculated by multiplying the average fluorescence in the cell with the cell area. The changes in cell fluorescence were monitored 5 seconds before the application of electric pulse and 60 seconds after. The arrow shows the time of electroporation.