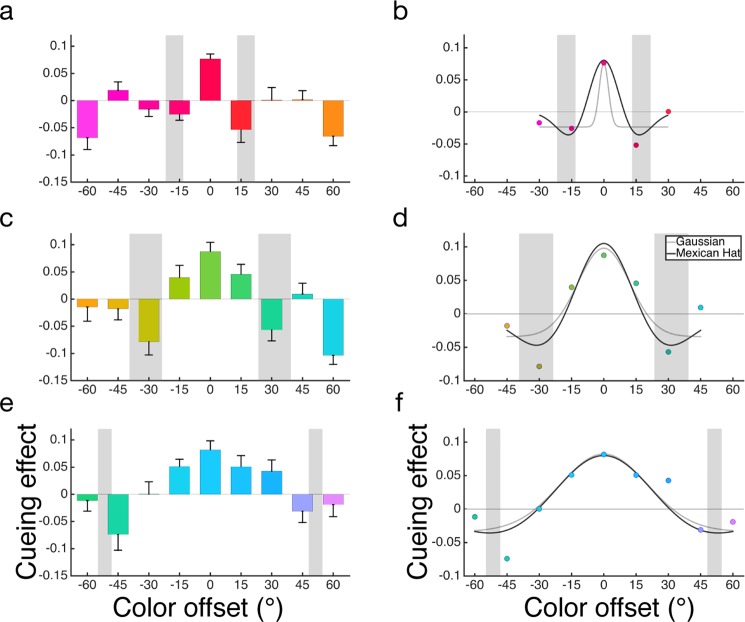
Figure 6.
Results for Experiment 1 (n = 10), 2 (n = 10) & 3 (n = 11). (a,c,e) Average cueing effect for all test colors measured as performance difference between color cue and neutral condition for Experiment 1, 2, & 3 respectively. (b,d,f). Best fitting non-monotonic Mexican hat function and monotonic Gaussian function to the observed data. The shaded areas in all six panels represent average category boundaries ± 1 SD. Error bars represent standard error of the mean.

