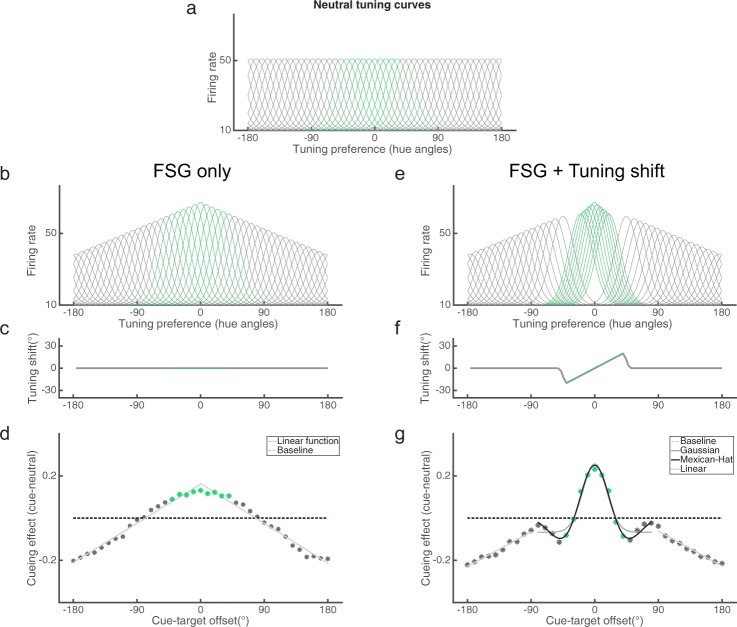
Figure 8.
A neural model for surround suppression. (a) Tuning curves for a subset of simulated neurons. Green curves represent neurons within a color category (±40°). (b) Tuning curves under a pure FSG modulation. (c) Tuning shift function under the pure FSG condition, which is always zero. (d) Behavioral cueing effect due to FSG (black dots) monotonically decreases and is fitted with a linear function (gray lines). (e) Tuning curves under a hybrid modulation of both FSG and tuning shift. (f) Tuning shift function under the hybrid model. (g) Behavioral cueing effect in the hybrid model exhibits a non-monotonic profile that is better fitted by a Mexican-hat function (black solid line) than a Gaussian function (dark gray solid line). Once outside the suppressive zone, the cueing effect further decreases (light gray solid line).

