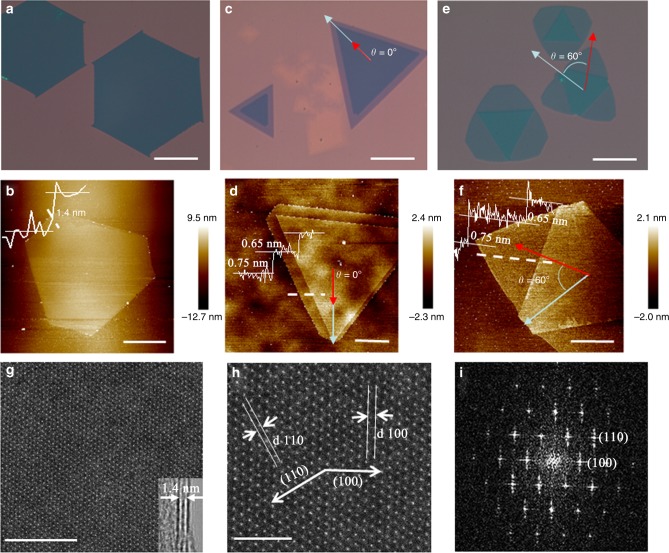
Fig. 2.
Characterization of the bilayer MoS2 crystals. a A representative optical microscope image and b a representative AFM surface morphology image of the as-grown AA stacking bilayer MoS2 samples with the maximum lateral size of even up to 300 μm. c A representative optical image and d a representative AFM surface morphology picture of the AA stacking bilayer MoS2 grains with distinct steps, where the twist angle from the relative rotation of the two vertically stacked triangles θ = 0° indicate the AA stacking order37,62,63. e A typical optical image and f a typical AFM surface morphology image of the as-grown AB stacking bilayer MoS2 samples, where the twist angle from the relative rotation of the two vertically stacked triangles θ = 60° indicate the AB stacking order37,62,63. Planar TEM images of the AA stacking bilayer MoS2 crystals: g low resolution and h high resolution as well as i the FFT pattern. The inset in g shows the folded edge of MoS2 bilayer films. Scale bars, 100 μm in a, c, and e, 20 μm in b, 2 μm in d, 5 μm in f, 5 nm in g, and 2 nm in h

