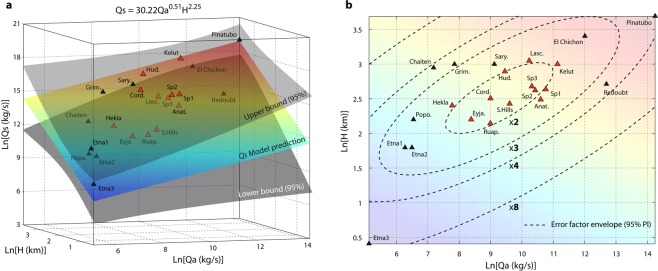
Figure 3.
Qs prediction model using model selection analysis. (a) Statistical relationship between Qs derived from fallout deposits, Qa derived from satellite-based measurements, and H (above the vent) derived from observations, in a three-dimensional natural logarithm space. The best Qs prediction model is shown as the coloured plane and the related equation is given in natural scale following a power-law at the top of the plot. It was selected by the AICc (Corrected Akaike Information Criterion) which gives a robust evaluation of the goodness-of-the-fit for small datasets. The error factor and related RMSE are provided at a 95% prediction interval. See Supplementary Information Table 2 for all the goodness-of-the-fit evaluation criteria. (b) Error factor contour levels related to the MER estimation plotted on the two-dimensional plane H vs. Qa in natural logarithm, and showing the anisotropy of the error distribution. Red triangles represent eruptions (12 over 22) for which the error factor value is ∼2 or less. Practically, this means that estimations of MER for future eruptions falling in this range of Qa (∼1 × 10³ to 1 × 10⁵ kg/s) and H (∼7 to 21 km) have a 95% probability to fall within an error factor of 2 only.

