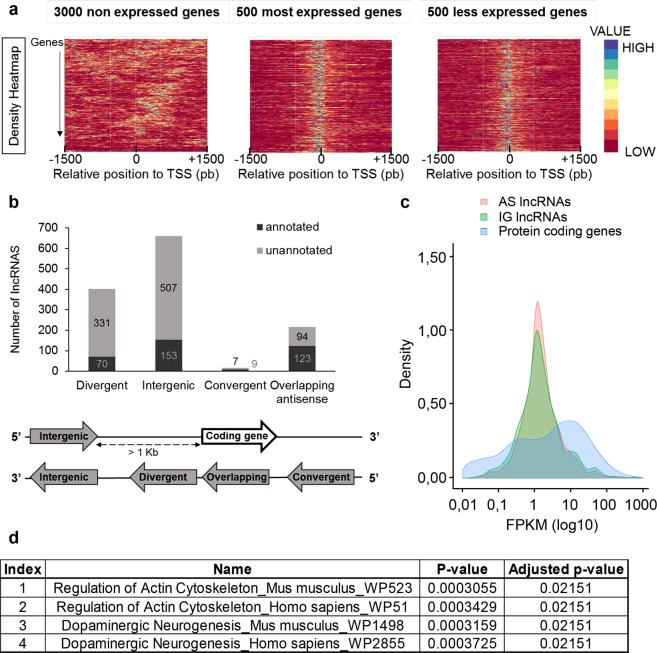
Figure 2.
Identification of the lncRNAs expressed in mesencephalic DA neurons. (a) Density heatmaps representing the height of ATAC-seq peaks relative to the TSS position of non-expressed (left), highly (middle) or weakly (right) expressed genes in FACS-purified DA neurons. (b) Number of lncRNAs depending on their categories as represented below the graph. Dark grey, lncRNAs annotated in Ensembl; light grey, lncRNAs unannotated. (c) Density plot of the coding genes described in Ensembl and the lncRNAs (AS: antisense, IG: intergenic). (d) Pathway analysis (Wikipathway 2016, Enrichr) performed on the neighbouring genes to the top 20% most expressed lncRNAs using 3 independent RNA-seq datasets.

