Figure 2.
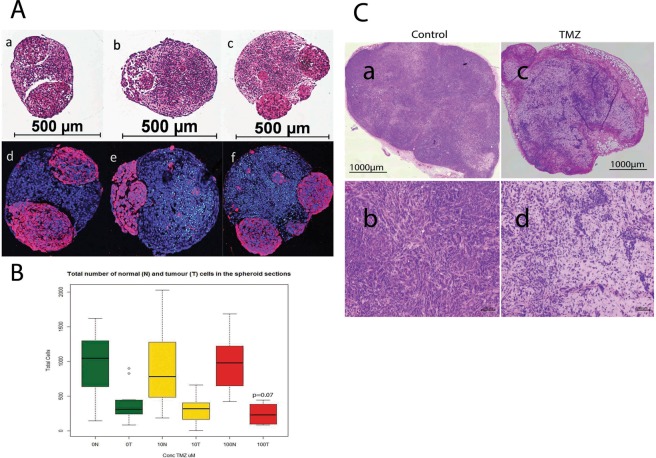
Effect of temozolomide (TMZ) treatment (10 and 100 uM) on the size of glioblastomas in vitro (gBS) and in vivo (nude mouse xenografts). Image analysis in the spheroid sections was performed by segmentation of tumour cells in the GFP channel in order to quantify their number relative to that of normal neuronal cells which were GFP negative (see materials and methods section 4.8 for details). Panel (A) a - H&E control; b - H&E 10 uM TZ; c - H&E 100 uM TMZ (glioblastomas are eosinophylic ‘pink’ cells); d–f show dual immunofluorescence (IF) stain of GFP (red) and cleaved caspase (green) with hoechst (blue) counterstain for control, 10 uM TMZ and 100 uM TZ, respectively. Panel (B) shows the total number of normal neuronal cells (N) and the total number of glioblastoma cells (T) in the spheroid sections.Box plots show the median (black horizontal line) and the upper and lower quartiles (ends of the boxes); whiskers show maximum and minimum values; open circles show outliers >1.5 times the interquartile range away from the upper and lower quartiles, n = 12. Panel (C): a, b show H&E stained sections of an untreated 965 xenograft tumor; c,d show H&E stained sections of a 965 xenograft tumor taken from a mouse treated with TMZ (100 μg/Kg)- see materials and methods section for details of the TMZ treatment(s).

