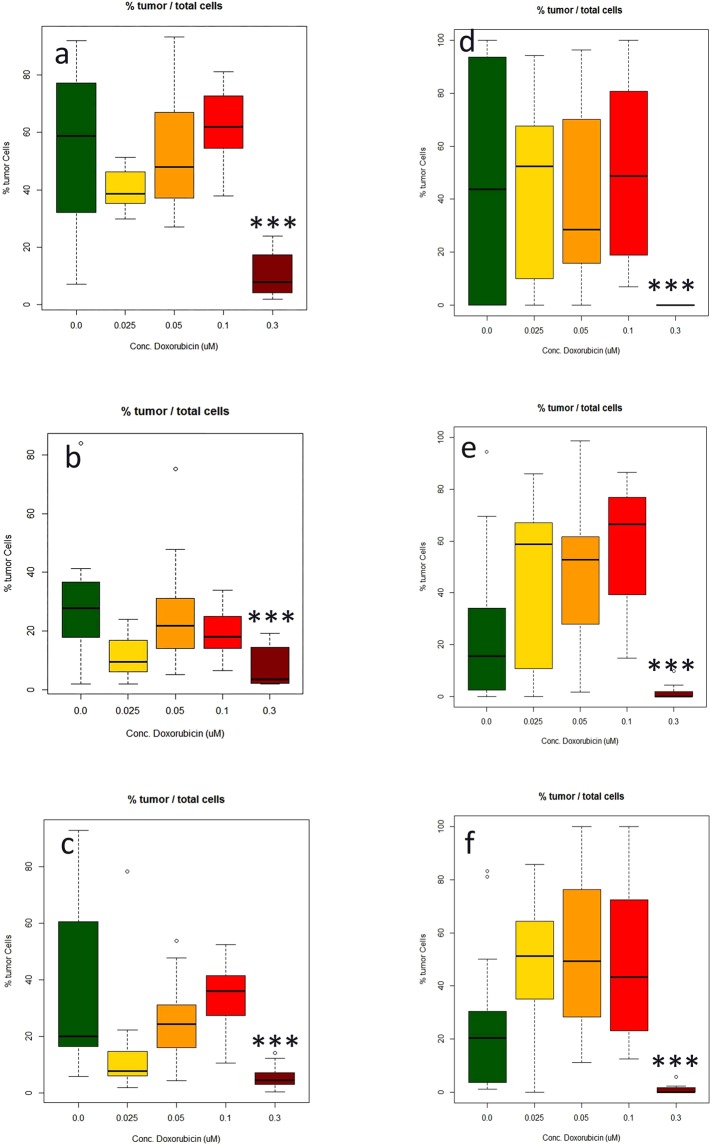
Figure 4.
Measurement of the effect of doxorubicin (DOX) treatment (0.025–0.3 uM) on the number of glioblastoma cells made in three different microTMAsections of the same array. (a–c) Manual image acquisition (Zeiss LSM confocal); (d–f) automated image acquisition and analysis (Perkin Elmer Polaris/Inform software). Values are expressed as percentages of the total numbers of glioblastoma cells in the spheroid sections relative to the total number of glioblastoma and normal neuronal cells. ***Significantly different from control p < 0.0001 by t test, n = 16.

