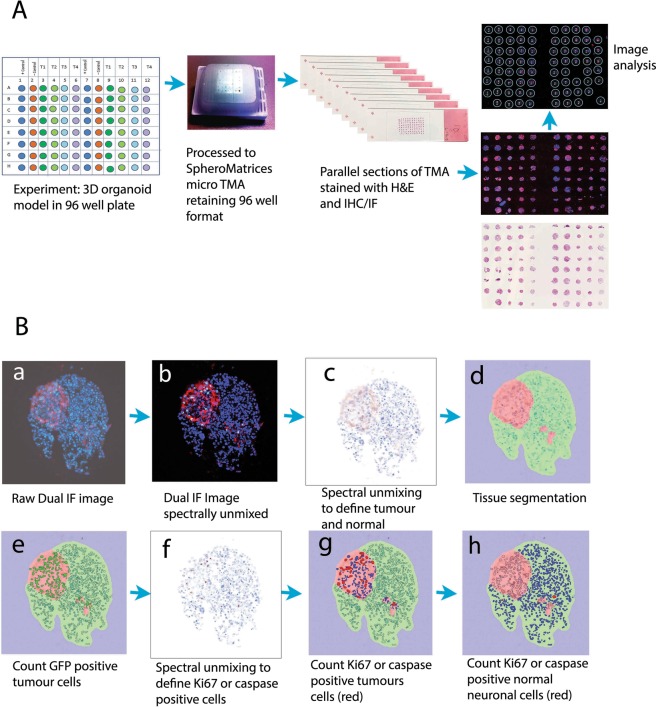
Figure 5.
Construction and image analysis of a spheroid tissue microarray (microTMA). Fixed spheroids were embedded in a microTMA mold prior to paraffin embedding and sectioning on a microtome. TMA sections were then immunofluorescence stained and imaged using confocal scanning followed by dearraying of the spheroid images and image analysis (see material and methods section 4.8). (A) Schematic showing construction and processing of the microTMA for high-throughput histology and image analysis of 3D spheroid cultures. (B) Image analysis process to quantify tumor size and the number of cleaved caspase 3 or Ki67 positive tumor cells or normal neuronal cells. a dual immunofluorescence stained section showing GFP positive cells (red) and Ki67 positive cells (green), blue cells (DAPI) are normal (non-tumor cells); b - spectral unmixing and removal of autofluorescence; c, d - segmentation in the red channel to define tumor and normal cells/areas; e–h: segmentation in the green channel to define Ki67 or caspase positive cells, which are then counted in the tumor- and normal-cell regions.

