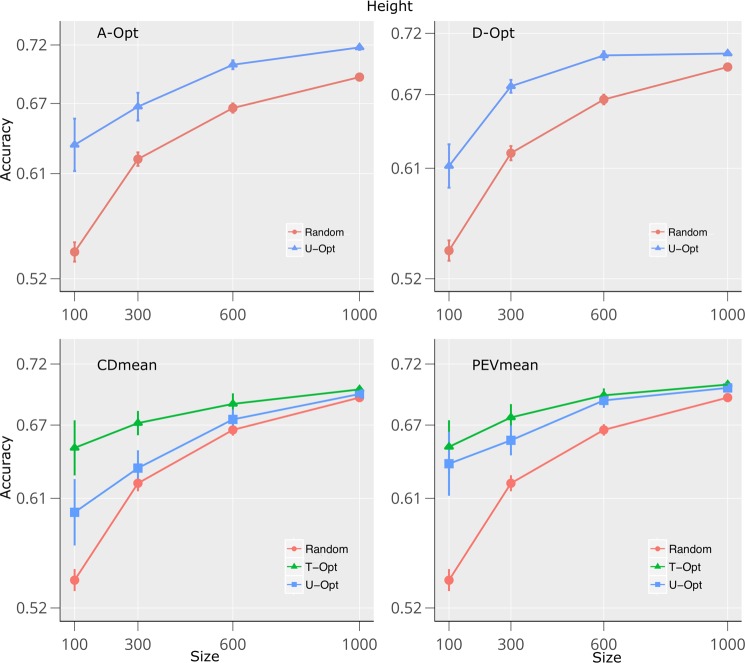
Figure 4.
Prediction accuracies for height trait using sampling algorithms within STPGA package on dataset 1. Accuracies of the predictions of the test set (TS) genotypes were calculated using 4 different algorithms and 2 methods compared with random sampling. In the U-Opt method, the TS were not used to build the training population set (TRS) while in the T-Opt the optimization algorithm used the TS to build the TRS. The TRS were defined by optimizing A-Opt, D-Opt, CDmean, and PEVmean. Four different population sizes (100, 300, 600 and 1000) were used for the optimization algorithm. Standard error is indicated for each point over 30 (U-Opt and T-Opt) and 100 (random) runs.

