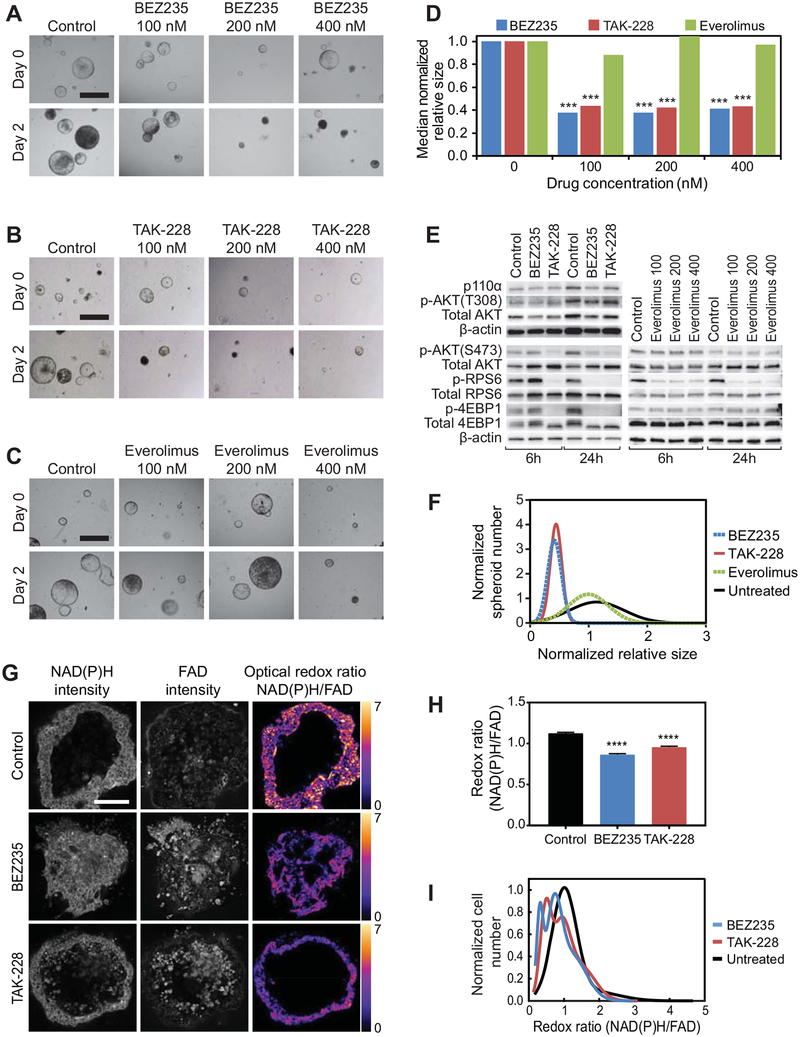
Figure 4. Apc and Pik3caH1047R mutant CRC spheroids are sensitive to MTORC1/2, but not MTORC1 inhibition alone.
Spheroids from Fc1 Apcfl/+ Pik3caH1047R cancers were allowed to mature for 24–96 hours. Brightfield images were obtained at baseline and following treatment with BEZ235, TAK-228, everolimus or control (A-C). Similar reductions in median relative spheroid size were observed with BEZ235 and TAK-228 compared to control (p < 0.001, A, B and D). Everolimus, an MTORC1 inhibitor, did not significantly decrease spheroid growth compared to control (C and D). Decreased phosphorylation of AKT (Ser473), RPS6 (Ser235/236), and 4EBP1 (Thr37/46) was observed at 6 hours following treatment with TAK-228, but not with BEZ235 or control (E). After 24 hours, similar reductions in the phosphorylation of AKT, RPS6 and 4EBP1 were observed (E). Everolimus did not reduce the phosphorylation of 4EBP1 (D). Population distribution histograms demonstrating variation in change in sphere size for Fc1 Apcfl/+ Pik3caH1047R CRC spheroids after 48 hours of treatment with BEZ235, TAK-228, everolimus, or control (F). Optical metabolic imaging was also utilized to confirm the therapeutic response. Representative images of NAD(P)H and FAD fluorescence intensities and optical redox ratio (G). The optical redox ratio (NAD(P)H intensity/FAD intensity) is decreased in spheroids treated with TAK-228 and BEZ235 compared to untreated spheroids (G and H). Subpopulation analysis of the redox ratio calculated from fluorescence images of untreated, BEZ235-treated, and TAK-228-treated CRC spheroids (I). The area under the curve for each treatment group was normalized to equal 1. Peaks represent high frequency of cells with similar optical redox ratios. Size bar in panel A-C = 1 mm, G = 100 μm. ****p < 0.0001.

