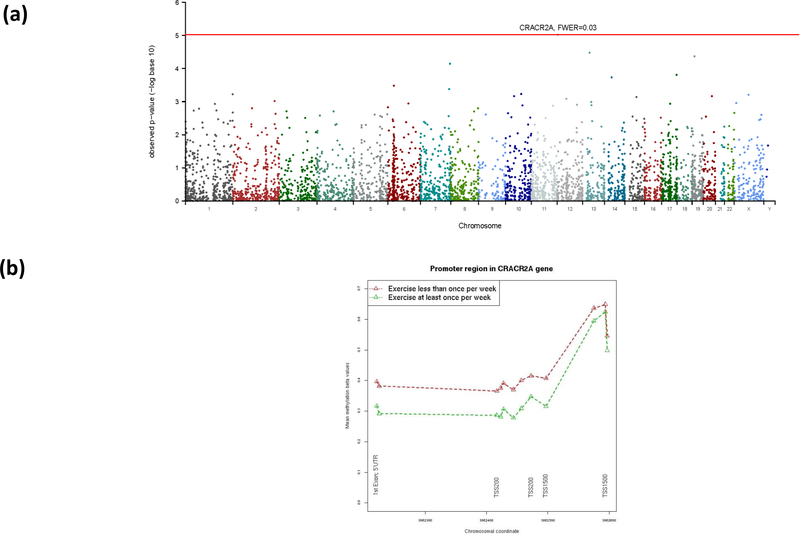
Figure 3:
DMR results using the Bumphunting method. (a) Manhattan plot for the DMR p-values. The bump with the smallest p-value reaches a family wise error rate of 0.026 and contains nine probes for the CRACR2A gene. (b) The probe-level methylation beta-values for the identified DMR in the promoter region of the CRACR2A gene. The first nine probes are in the DMR.

