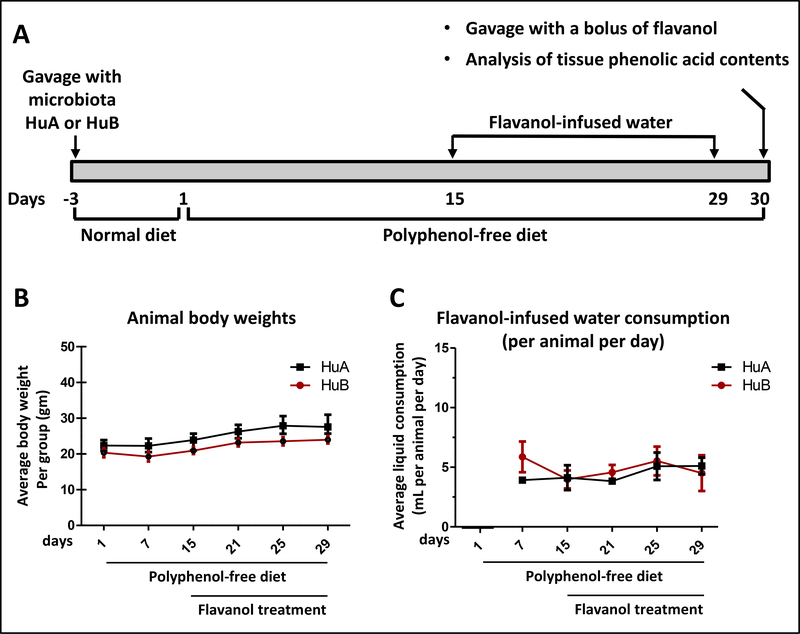
Fig. 1. Body weight and liquid intake of HuA and HuB mice.
(A) Schematics of the overall experimental design. (B, C) Body weight (B) and liquid intake (C) of HuA and HuB mice. In (B,C), points represent the mean (±SE) per mouse group with an n value of 6–7 per group. There was no detectable difference in body weight, as well as in the consumptions of water or FRP-infused drinking water between the two groups of gnotobiotic mice during the course of the study.

