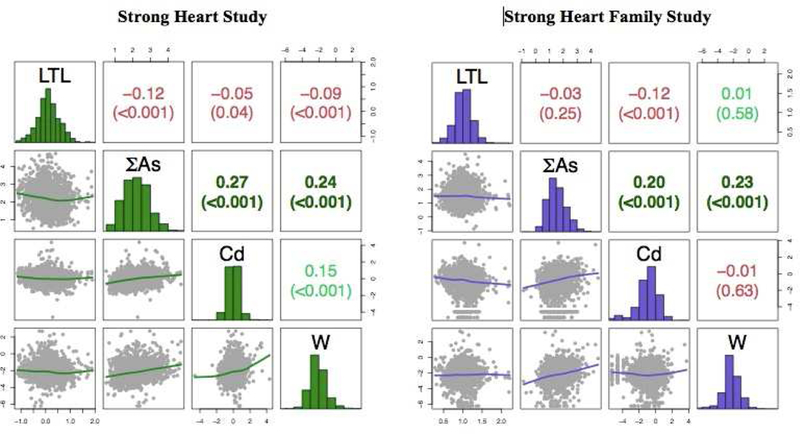
Figure 1. Pairwise Spearman’s correlations (p-value) between leukocyte telomere length and creatinine-corrected urine arsenic, cadmium and tungsten concentrations, among Strong Heart Study (n=1,702) and Strong Heart Family Study (n=1,793) participants.

Metals were corrected for urine dilution by dividing for urine creatinine. The diagonal panel shows the histograms of the log-transformed distribution of leukocyte telomere length and each metal. The upper panel represents the Spearman pairwise correlation coefficients. The lower panel shows the pairwise scatterplots. The axes indicate values in the log-scale. Negative correlations coefficients were colored in red, positive correlations were colored in green. Abbreviations: LTL, leukocyte telomere length.
