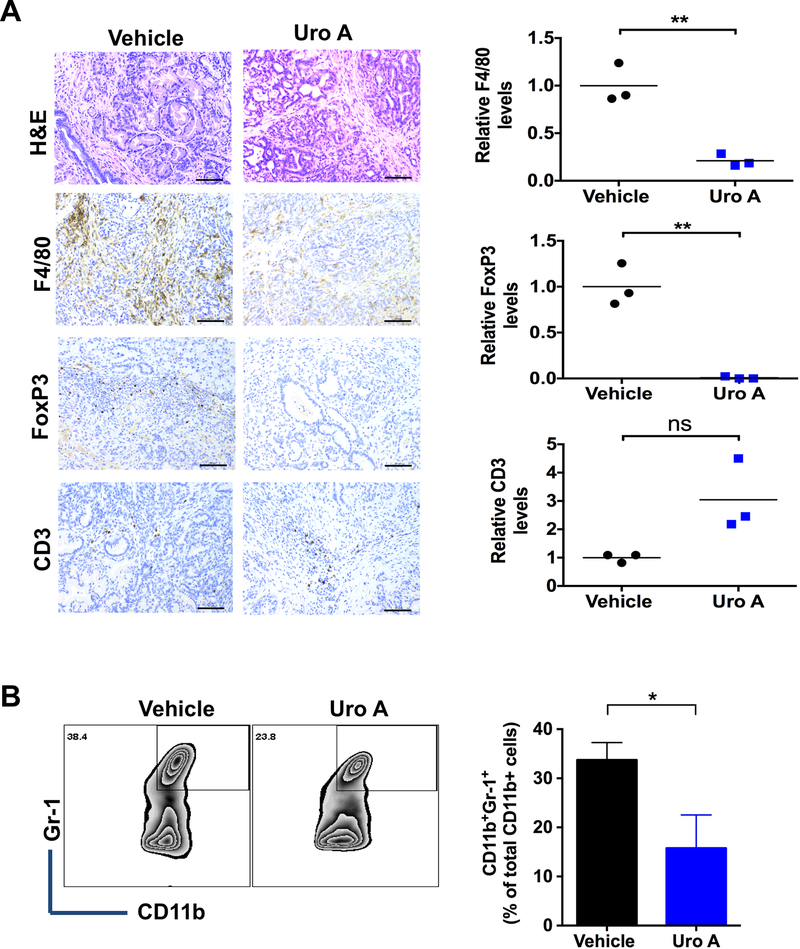
Figure 5.
Effects of Uro A on TAMs, Tregs and MDSCs in PKT mice. A. Representative H&E, F4/80, FoxP3 and CD3 staining of pancreatic tissues harvested from Uro A-treated PKT mice (left panel). Scale bar: 50μm. Quantification of relative levels of F4/80, FoxP3 and CD3 immunohistochemical staining of Uro A and vehicle-treated PKT mice pancreata (right panel) (n=3). B. Representative flow cytometry zebra plots (left panel) and their corresponding bar graphs (right panel) of MDSCs in the single suspensions of vehicle or Uro A-treated PKT mice pancreata (n=3). *, P < 0.05; **, P < 0.01

