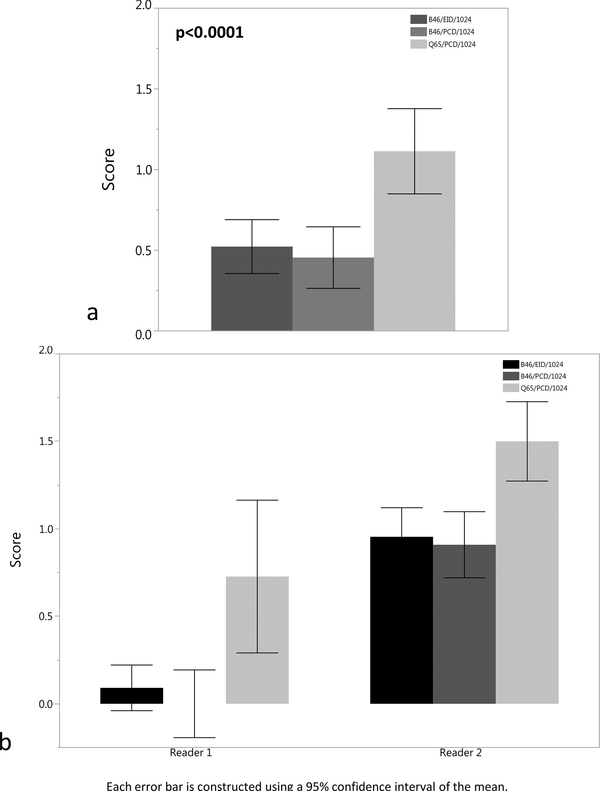
Figure 2.
(a-b). (a) Bar plot of mean score for 3rd order bronchial wall evaluation for the B46/EID/1024, B46/PCD/1024, and Q65/PCD/1024 images compared to clinical reference (B46/EID/512) images demonstrating definitely better visualization of the 3rd order bronchial walls for the Q65/PCD/1024 images (mean = 1.1). The Q65/PCD/1024 mean score is also statistically higher than the B46/EID/1024 (mean= 0.5) and B46/PCD/1024 (mean= 0.5) images (p <0.0001).(b) Bar plot demonstrating 3rd order bronchial wall evaluation by individual reader.

