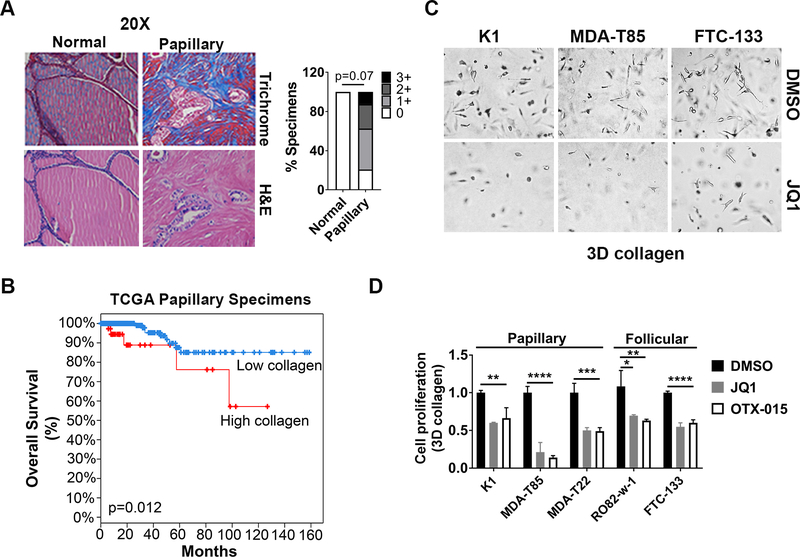
Figure 1: BET inhibitors (BETis) decrease growth of cancer cells in 3D collagen.
A. Human thyroid tissue microarray (TMA) containing 24 papillary thyroid specimens and 8 adjacent normal tissue samples was trichrome stained, and the relative staining was graded as low (0 or 1+) or high (2+ or 3+). Fisher’s exact test was used to calculate p value. B. cBioportal analysis of Kaplan-Meier survival curve of papillary thyroid cancer patients in the TCGA database with or without relative overexpression of fibrillar collagen. C and D. Thyroid cancer cells growing in 3D collagen were treated with the BETis JQ1 (1 μM) and OTX-015 (1 μM) for 72 hours. The cells were examined by phase microscopy (C), and the effect on proliferation was determined by WST-1 assay (D). *, p<0.05; **, p<0.01; ***, p<0.001; ****, p<0.0001. The results are representative of at least three independent experiments.

