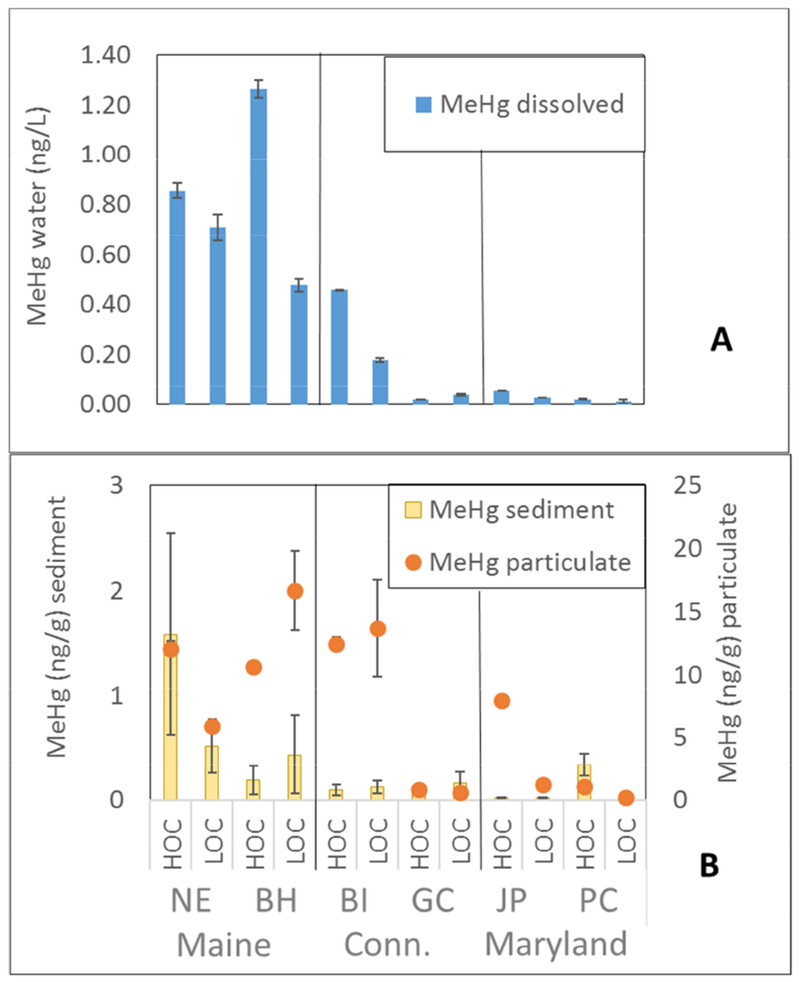
Fig. 3A).

Concentrations of dissolved MeHg (ng/L) in the water column, and B) Concentrations of MeHg (ng/g) in suspended particulates and in sediment, across subsites. Error bars represent low and high tide values of MeHg in the water column, and min/max values of MeHg in sediment.
