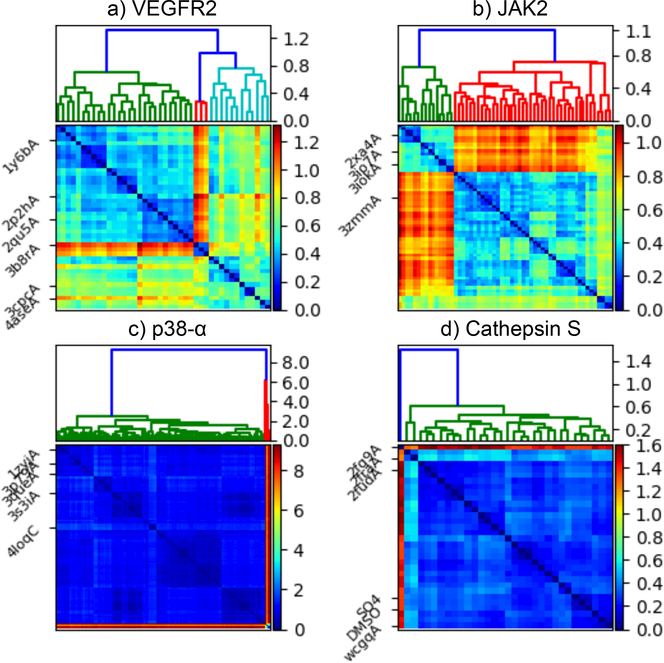
Fig. 1. Analysis of homologous structures in the PDB.
Hierarchical clustering dendrograms (top) and binding site RMSD matrices (bottom) for (a) VEGFR2, (b) JAK2, (c) p38-α, and (d) Cathepsin S. Selected structures are labeled on the left of the RMSD matrices. Except for the SO4 and DMSO labels for Cathepsin S, which denote the provided structures in complex with the respective ligands, the labels are PDB identifiers.

