Figure 2.
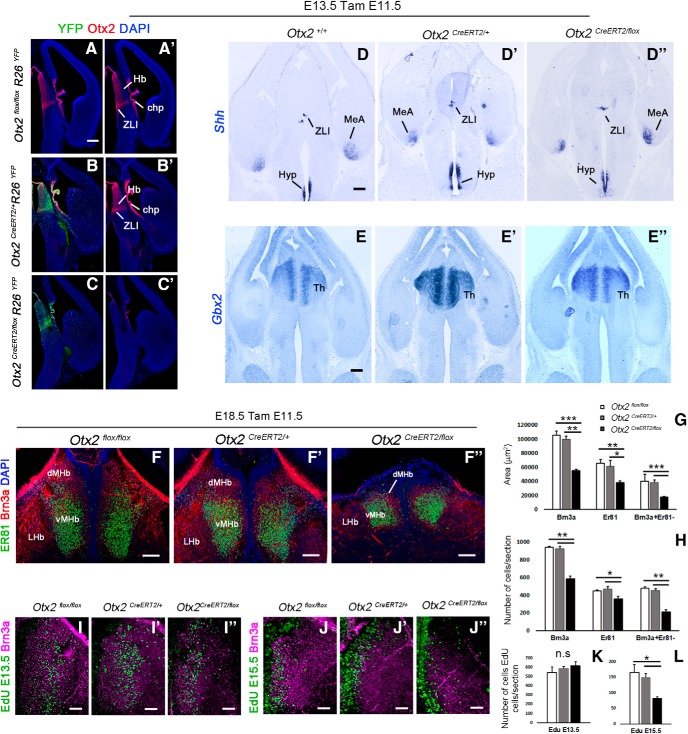
Conditional deletion of Otx2 produces habenular hypoplasia. A–C′, Coronal sections of E13.5 control and mutant embryos injected with tamoxifen at E11.5 showing the expression of the reporter YFP and Otx2 in the diencephalon. In situ hybridization for Shh (D–D′′) and Gbx2 (E–E′′) in coronal section of E13.5 mutant and control mice injected with tamoxifen at E11.5. F–F′′, Immunostaining for Er81 (Etv1) and Brn3a in coronal sections at the level of the habenula in E18.5 embryos that have been injected with tamoxifen at E11.5 stage. G, Graph representing the average area in square micrometers of the MHb per coronal section at E18.5. The MHb areas are significantly reduced in mutant mice (black column, Otx2CreERT2/flox) compared with control mice (white and gray columns, Otx2flox/flox and Otx2CreERT2/+ respectively). H, Graph representing the average numbers of Brn3a+ cells, Er81+ cells, and Brn3a+Er81− cells per coronal section in the MHb at E18.5. The number of Brn3a+ cells in the MHb is reduced in mutant mice compared with control mice. However, the reduction of the number of Er81+ cells in the ventral MHb is less severe compared with the reduction of the Brn3a+ Er81− cells in the dorsal MHb. I–L, EdU labeling combined with Brn3a immunostaining in coronal sections showing Edu+ cells in the MHb in control and mutant E18.5 embryos when the EdU was injected in pregnant females at E13.5 (F–H) and E15.5 (I–K). K, L, Graph representing the average number of EdU cells in the MHb per coronal section in control and mutant E18.5 embryos. Note that the number of Edu cells does not change significantly when the EdU was injected at E13.5. However, there were fewer EdU+ cells in mutant mice compared with controls when EdU was injected at E15.5. n.s., Nonsignificant. p-values are represented on the graphs as follows: *p < 0.05; **p < 0.01; ***p < 0.001. However, there were fewer EdU+ cells in mutant mice compared with controls when EdU was injected at E15.5. MeA, Medial amygdala; Hyp, hypothalamus; Th, thalamus. Scale bars, A–E′′ (shown in A, D, and E), 100 μm; F–F′′, 100 μm; I–J′′, 50 μm.

