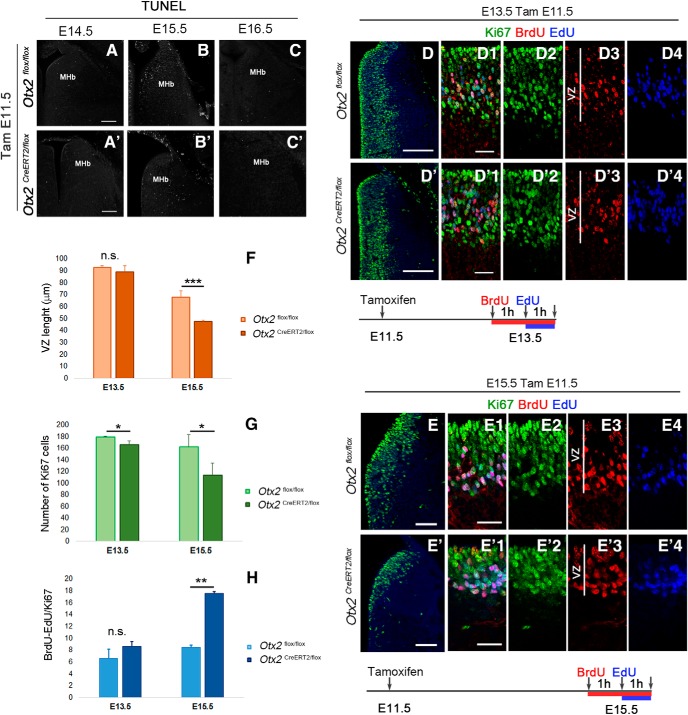
Figure 3.
Loss of Otx2 alters habenular progenitor cell cycle. A–C′, Tunnel staining to detect cell death in coronal sections at the level of the MHb at different embryonic stages in control (A–C) and Otx2 mutant embryos (A′–C′) injected with tamoxifen at E11.5. D–E′, Immunofluorescence for Ki67 labeling progenitor cells in the habenular region in coronal section at E13.5 (D, D′) and E15.5 (E, E′) of control (D, E) and mutant (D′, E′) embryos tamoxifen injected at E11.5. D1–E′4, High magnification of the VZ showing immunolabeling of Ki67 and BrdU cells and EdU staining in control and mutant mice at E13.5 (D1–D′4) and E15.5 (E1–E′4) when BrdU was injected 2 h and EdU 1 h before pregnant females were killed. Graphs representing the length in micrometers of the VZ (F), the average number of Ki67 cells in coronal section per area (G), and the average number of BrdU+ EdU− cells relative to the area (H) in control and mutant E13.5 and E15.5 embryos. p-values are represented on the graphs as follows: *p < 0.05; **p < 0.01; ***p < 0.001. n.s., Nonsignificant. Scale bars, A–C′ (shown in A, and A′, 100 μm; D–E′, 100 μm; D1–E′4 (shown in D1, D′1, E1, and E′1), 25 μm.

