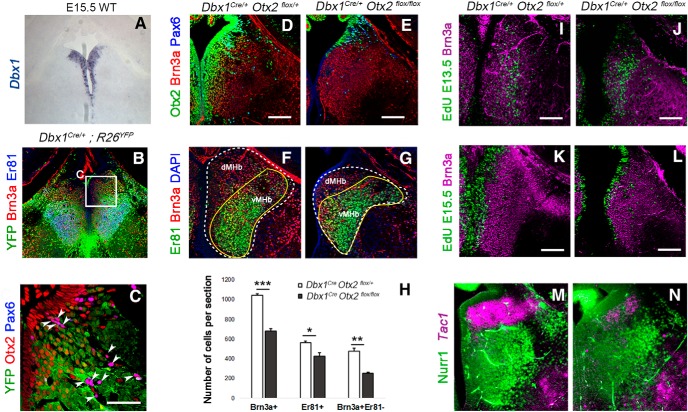
Figure 4.
Specific deletion of Otx2 in Dbx1 domain. A, Dbx1 expression pattern in the ventricular zone of the MHb at E15.5. B, C, Coronal section of a E18.5 Dbx1Cre control embryo revealing Dbx1 lineage in the habenula. Immunofluorescence for YFP, Brn3a, and Er81 (Etv1) (B). High magnification of a similar area as indicated in B showing Otx2/Pax6+ cells that are negative for YFP and therefore not generated from Dbx1+ progenitors (C). D, E, Immunostaining in coronal sections for Otx2, Brn3a, and Pax6 in control (D) and Otx2 conditional mutant embryos (E) at E18.5. F, G, Immunolabeling for Er81 and Brn3a in coronal sections of control and mutant E18.5 embryos. H, Graph representing the average number of Brn3a+ cells (Brn3a+), Er81+ cells (Er81+), and Brn3a+ Er81− (Brn3a+ Er81−) cells per coronal section in the MHb of control and Otx2 mutant E18.5 embryos. I–L, EdU staining and Brn3a immunolabeling in coronal sections of the MHb in E18.5 control and Otx2 mutant embryos when the EdU was injected at E13.5 (I, J) and E15.5 (K, L). M, N, In situ hybridization using Tac1 RNA probe in combination with immunostaining of Nurr1, a marker of the vMHb, in coronal sections of control (M) and Otx2 cKO animals (N) at E18.5. p-values are represented on the graphs as follows: *p < 0.05; **p < 0.01; ***p < 0.001. Scale bars, A, B, 175 microns, C, 50 microns (shown in C); D–L 100 microns, M, N, 75 microns (shown in D, E, I–L).

