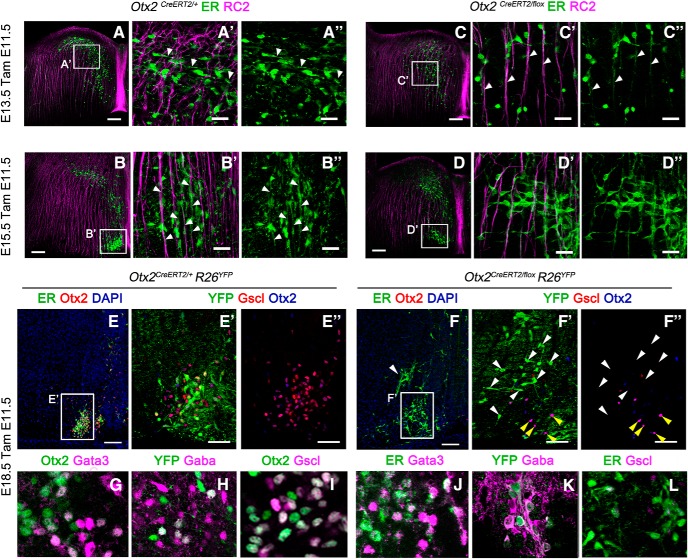
Figure 6.
Migrational defects in IPN neurons due to Otx2 deletion is not a consequence of fate switch. A–D, Immunofluorescence to visualize Otx2 neurons (ER) and radial glia cells (RC2) in transversal section of r1 at the levels of the caudal IPN in control (A, B) and mutant (C, D) embryos at the E13.5 and E15.5 stages injected with tamoxifen at E11.5. A′–D′′, High magnification of the area indicated in A–D. The white arrowheads indicate the orientation of the Otx2+ cells leading process with respect to the radial glia. E, F, Immunofluorescence for CreERT2 (ER) and Otx2 in transversal sections of E18.5 control and mutant embryos showing the disposition of Otx2+ cells when the migration is completed. The white arrowhead in F indicates the aberrant position of ER+ cells that have lost the expression of Otx2.(E′–F′′), High magnification of the area indicated in E and F showing cells labeled with YFP, Gscl, and Otx2 in the caudal IPN. Note that the YFP+ cells are the one that lose the expression of both Otx2 and Gscl and are mislocalized (white arrowheads), whereas the Otx2+ cells that are not recombined migrate properly (yellow arrowheads), indicating a cell-autonomous defect. G–L, Immunofluorescence in transversal sections of E18.5 control and mutant embryos showing the expression of the main V2b interneurons markers in Otx2+ cells. Scale bars, A–F, 100 μm, E′–F′, 50 μm; A′–D′′, G–L, 25 μm.

