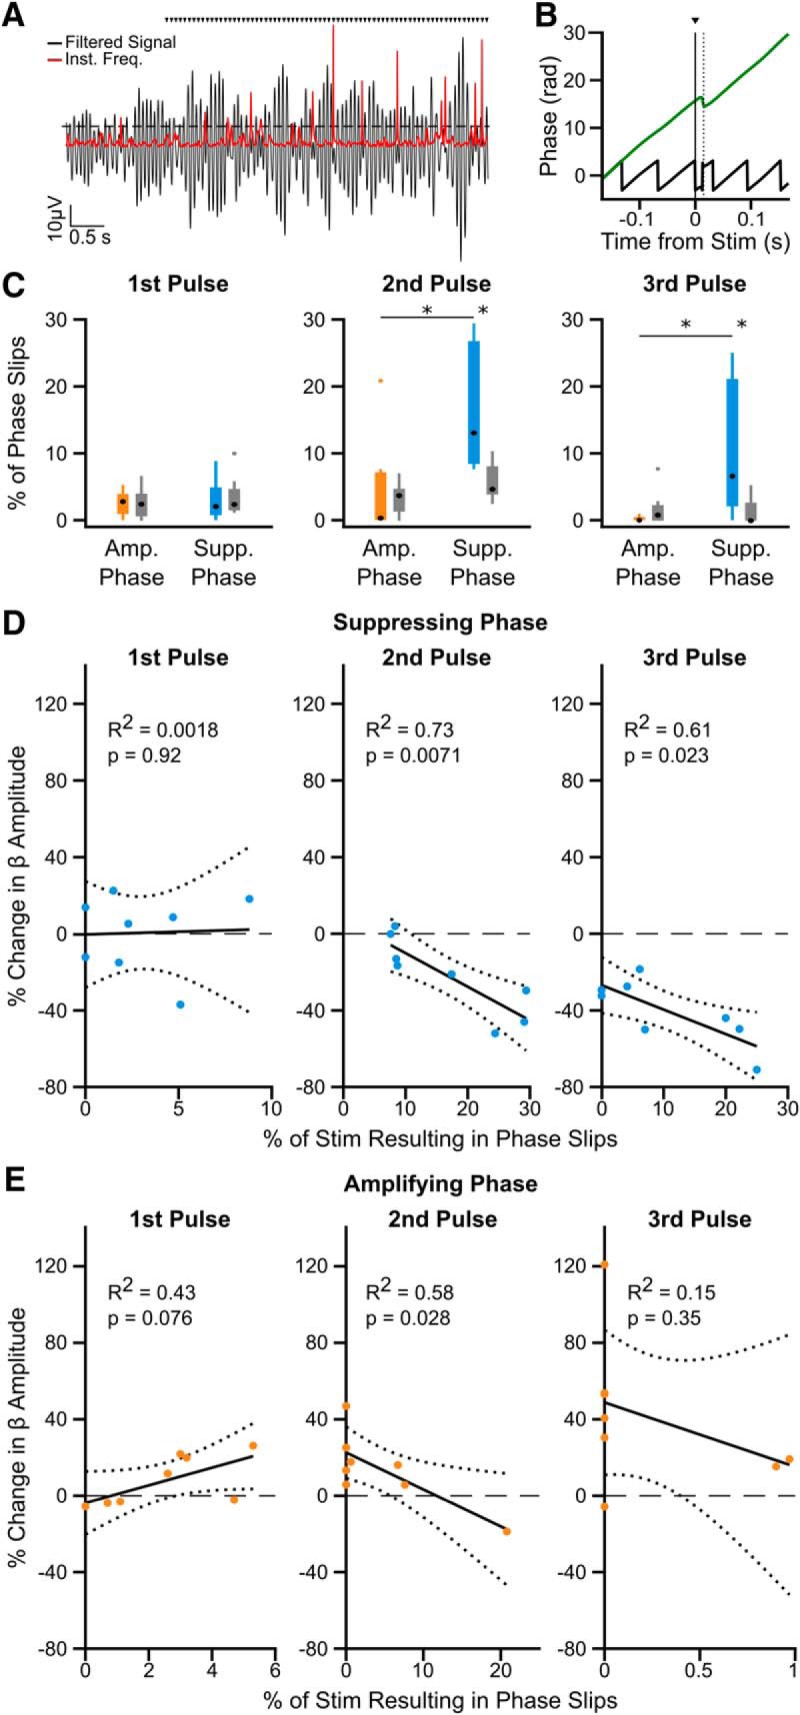
Figure 6.

Increased phase slips in the beta oscillation following consecutive pulses at the suppressing phase correlates with amplitude reduction. A, Phase slips were defined when the instantaneous frequency (red) of the beta filtered signal (black) crossed 2 SD above the mean (dotted line), indicating a phase discontinuity in the oscillatory signal. Black triangles indicate stimulation pulses. B, Example phase slip within 15 ms following a stimulus pulse (dotted line), seen in both the unwrapped phase (green) and phase (black) of the oscillation. C, The percentage of stimulus pulses with phase slips occurring within 15 ms following the first (left), second (middle), and third (right) consecutive pulse at the amplifying (orange) or suppressing (blue) phase. Significantly more phase slips are seen after two (W = 94, p = 0.00420) and three (W = 90, p = 0.0120) pulses at the suppressing phase than at the amplifying phase (Wilcoxon ranked sum test), and when compared with surrogates generated by running identical analysis on a time-matched unstimulated segment of the recording (2 pulses: W = 92, p = 0.0096; 3 pulses: W = 88, p = 0.0297; Wilcoxon ranked sum test). (Asterisks indicate p <= 0.05) D, The percentage of phase slips occurring after the second (middle) and third (right) pulse at the suppressing phase correlates with the reduction in beta amplitude (F = 15.984, p = 0.00710; F = 9.252, p = 0.0230, linear regression), but not following the first pulse (left; F = 0.0110, p = 0.92, linear regression). Note maximum x-axis values are variable. E, The percentage of phase slips only correlates with beta oscillation amplification after the second consecutive pulse at the amplifying phase (middle; F = 8.234, p = 0.0280, linear regression), not after the first (left) or third (right). Note the change in x-axis values compared with those in D, as less phase slips occur at the amplifying phase.
