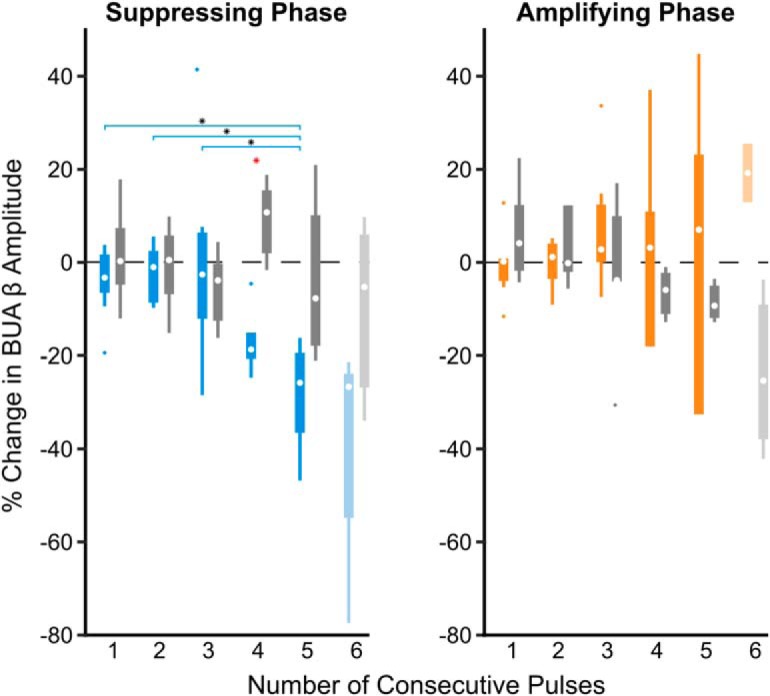
Figure 9.

Consecutive stimulus pulses at the suppressing phase leads to suppression of the beta synchronous STN unit activity. BUA was filtered around the peak beta frequency detected in the LFP. Median percentage changes in the oscillation amplitude (compared with the median) following stimulation at the suppressing (blue) and amplifying (orange) phase were grouped across eight patients. Suppression of beta-frequency activity in the BUA was dependent on the number of consecutive stimuli delivered at the suppressing phase of the LFP oscillation (χ2 = 15.06, p = 0.00460, Kruskal–Wallis test), whereas amplification was not (χ2 = 1.65, p = 0.799, Kruskal–Wallis test). As six consecutive stimuli were only observed in 4 of the 8 patients at the suppressing phase and two of eight patients at the amplifying phase (indicated by lighter boxes), these was not included in the Kruskal–Wallis test. Horizontal lines with black asterisks indicate differences between groups (corrected for multiple comparisons using post hoc Dunn test, p ≤ 0.05). Red asterisks indicate stimulation effects significantly different from surrogates (p ≤ 0.05, Wilcoxon ranked sum test, FDR-corrected).
