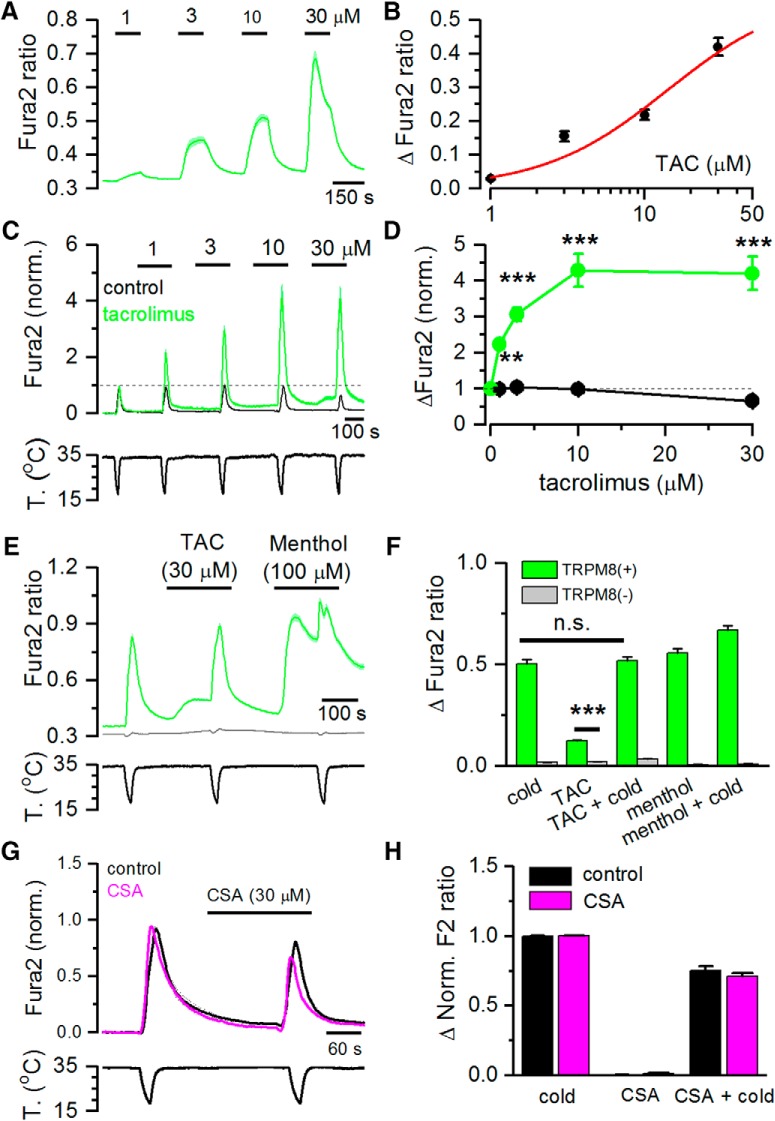
Figure 1.
TAC activates recombinant TRPM8 channels and potentiates cold-evoked responses. A, Average ± SEM fura-2 ratio changes in HEK293 cells stably expressing rat TRPM8 during sequential application of TAC at different concentrations (n = 105). B, Dose–response curve of TAC effects on TRPM8-expressing cells. Data have been fitted with a logistic function (EC50 = 14.1 ± 25.9 μm). C, Average ± SEM time course of fura-2 ratio in HEK293-expressing mouse TRPM8 during consecutive application of cold pulses in control solution (black trace, n = 15) or in the presence of increasing TAC concentrations (green trace, n = 16). Bottom, Time course of the corresponding temperature ramps. In the absence of TAC, the response to cold was relatively stable, whereas in the presence of TAC, the response to cold was strongly sensitized. Responses in individual cells have been normalized to their response to the first cooling pulse. D, Summary plot of the effect of different doses of TAC on the amplitude of cold-evoked responses in mTRPM8 cells. **p < 0.01 (ANOVA test in combination with Bonferroni's post hoc test). ***p < 0.001 (ANOVA test in combination with Bonferroni's post hoc test). E, Average ± SEM fura-2 ratio responses to cold, TAC (30 μm), and menthol (100 μm) in HEK293 cells transiently transfected with human TRPM8 and GFP. Green represents GFP(+) cells (n = 132). Gray represents GFP(−) cells (n = 87). F, Summary of mean responses in cells transfected with hTRPM8 (green bars) to the different agonists. Gray represents the responses of untransfected, GFP(−) cells. TAC produced a significant activation of hTRPM8 (***p < 0.001; unpaired Student's t test). G, Average ± SEM fura-2 ratio changes in HEK293 cells stably expressing rat TRPM8 during application of two cooling ramps. For the black traces (n = 25), cooling ramps were delivered in control solution. For the pink traces (n = 107), the second cooling ramp was applied in the presence of 30 μm cyclosporine (CSA). H, Histogram summarizing the effects of cyclosporine on cold-evoked calcium responses during the protocol shown in G. No significant differences were found between the cells perfused with control solution or cyclosporine (unpaired Student's t test).

