Figure 1.
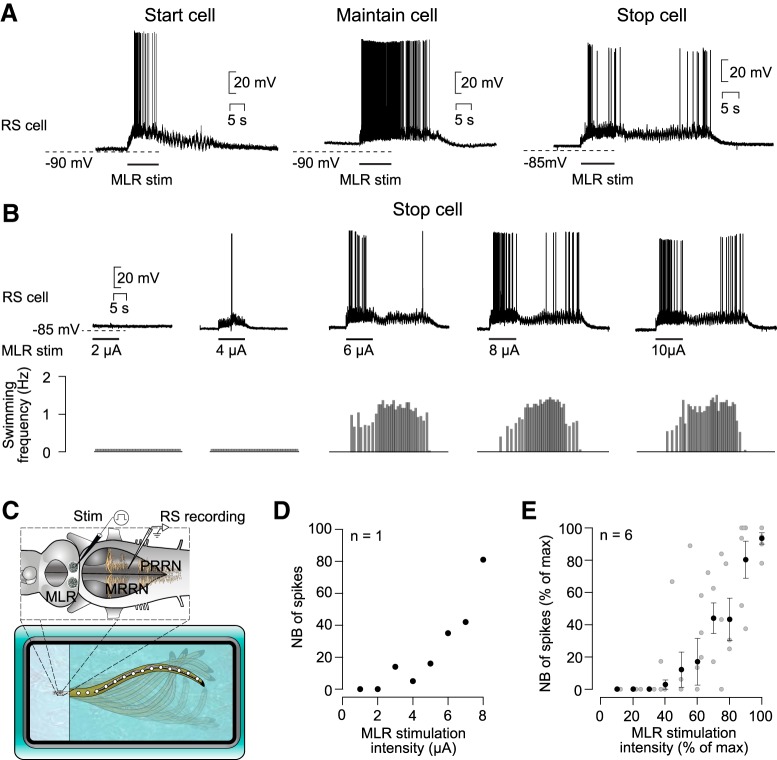
Response of stop cells to MLR stimulation of increasing intensity. A, Activity pattern of three populations of RS cells in response to MLR stimulation (adapted from Juvin et al., 2016): start cell (left), maintain cell (middle), and stop cell (right). B, Concurrent intracellular recording of a stop cell (top) and swimming activity (bottom) in a semi-intact preparation in response to different MLR stimulation intensities (2–10 μA). C, Schematic representation of the semi-intact preparation. The brainstem is illustrated with intracellular (RS cells) and stimulation electrodes (MLR). Swimming movements of the intact body are monitored with a video camera. D, Relationship between the number of spikes in the termination burst and the intensity of the MLR stimulation (n = 8 trials recorded in one stop cell). E, Similar representation as in D, but for six stop cells recorded in six preparations. Pooled data (black dots) were binned as a function of maximal stimulation intensity with a bin size of 10% (52 individual trials; gray dots). The number of spikes and the stimulation intensities were normalized and are represented as a percentage of maximal values.

