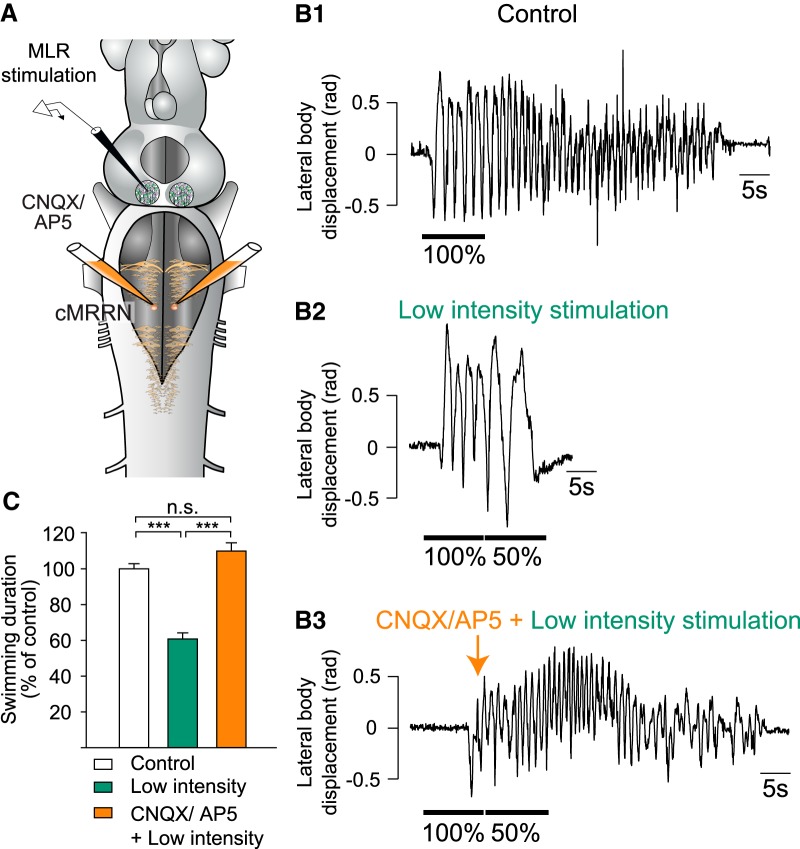
Figure 10.
Effects of glutamatergic blockage in the stop cell region. A, Schematic representation of the brainstem illustrating injection and stimulation sites. Note that the experiments were performed in a semi-intact preparation in which locomotion was induced and stopped by electrical stimulation of the MLR. A mixture of CNQX and AP5 was ejected bilaterally over the stop cell region in the caudal MRRN. B1, Swimming was induced with electrical MLR stimulation and stopped by applying a second MLR stimulation at a lower intensity at the end of the first MLR stimulation (B2). B3, Same as in B2 but after locally ejecting CNQX and AP5 over the stop cell region. C, Bar graphs illustrating the average values obtained in five animals for the three conditions shown in B. Data were normalized to the mean of control. Bars represent the mean ± SEM of pooled data (n = 25 trials in 5 animals for each condition). ***p < 0.001; n.s. not statistically significant.

