Figure 2.
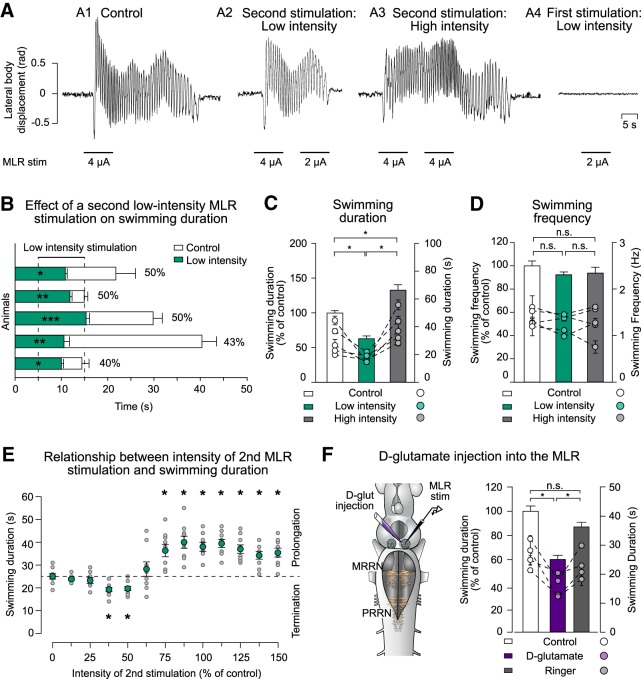
Effect of a second MLR stimulation on the swimming duration. A, Lateral displacement of the body (rad) is plotted for swimming bouts elicited by electrical MLR stimulation (control condition; 4 μA; A1) when a second MLR stimulation of low intensity (2 μA; A2) or high intensity (4 μA; A3) was delivered 5 s after the end of the first MLR stimulation. MLR stimulation of low intensity did not trigger locomotion at rest (2 μA; A4). B, Bar graphs illustrating the swimming duration (mean ± SEM) in control conditions (white bars) and when the MLR was stimulated a second time at low intensity while the animal was swimming (green bars). Each line represents one animal (n = 5 trials for each condition). Time 0 represents the end of the first MLR stimulation. C, Histogram illustrating the average swimming duration under control condition (white bar) and when the MLR was stimulated a second time with low-intensity stimulation (green bar) or high-intensity stimulation (gray bar). Bars represent mean ± SEM of pooled data that were normalized to control (n = 25 trials in 5 animals; left y-axis). Dots represent mean ± SEM of raw data for each animal (n = 5 stimulations for each animal; right y-axis). D, Comparison of the average swimming frequency in three conditions: control (white bar), when a second MLR stimulation of low intensity is delivered (green bar), and when a second MLR stimulation of high intensity is delivered (gray bar). E, Swimming duration as a function of the intensity of the second MLR stimulation. For each trial, swimming was elicited by electrical MLR stimulation (100%). Intensities of the second MLR stimulation were altered from 0% to 150% of control in 12.5% steps. Gray dots represent swimming duration for each individual trial (n = 9 trials in 3 animals for each condition); green dots represent average duration (mean ± SEM). The dotted horizontal line indicates the average swimming duration under control conditions when no second stimulation was delivered to the MLR. F, Left, Schematic representation of the experimental setup when the second MLR stimulation was delivered by injection of small d-glutamate quantities (2–3 pulses of 20 ms; volume ejected: 0.36–0.55 pmol) or Ringer's solution. Right, Bar graph illustrating the average swimming duration in control conditions (white bar) and when d-glutamate (violet bar) or Ringer's solution (gray bar) was applied into the MLR during ongoing swimming. Data were normalized to the mean of control. Bars represent the mean ± SEM of pooled data (n = 20 trials in 4 animals for each condition; left y-axis). Dots illustrate mean ± SEM of raw data for each animal (right y-axis). *p < 0.05; **p < 0.01; ***p < 0.001; n.s. not statistically significant.

