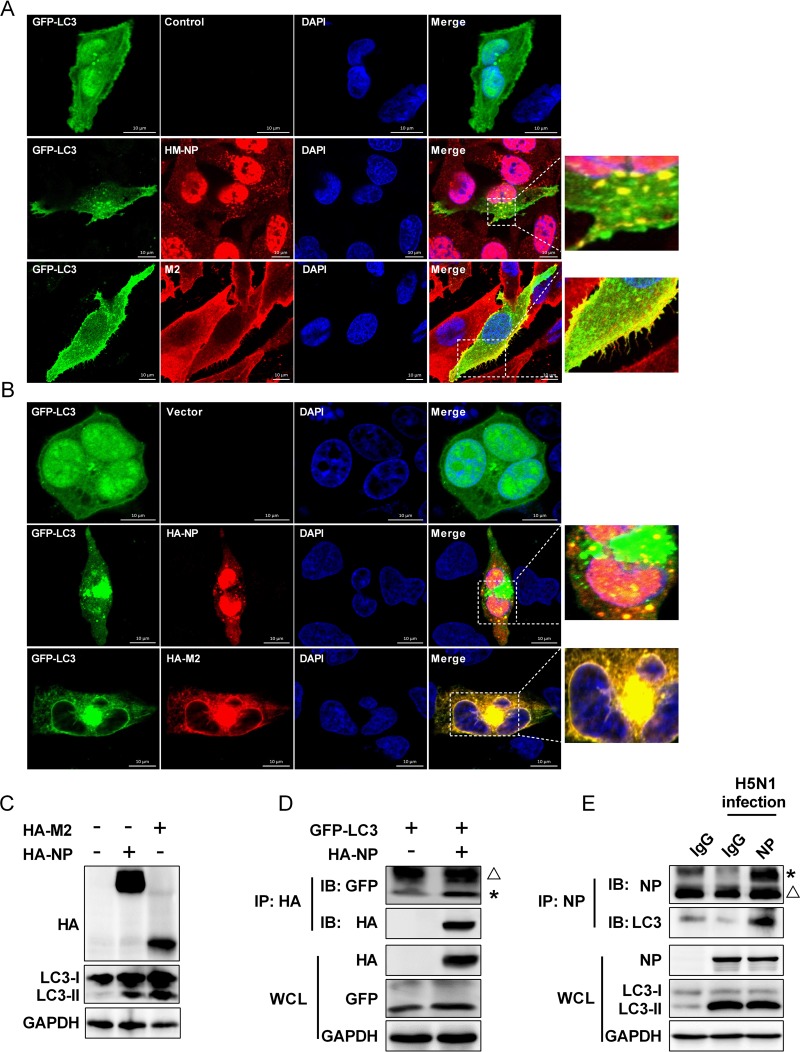
FIG 6.
IAV NP and M2 proteins induce autophagy and interact with LC3. (A) A549 cells were transfected with GFP-LC3 for 24 h and then were mock-infected or infected with the HM/06 virus. Twenty-four hours later, cells were fixed and stained with anti-NP or -M2 antibody and then visualized by confocal microscopy. In the zoomed images, yellow spots indicate the merging of M2 or NP with LC3 puncta. The image is representative of 20 cells. Scale bar, 10 μm. (B) A549 cells were cotransfected with GFP-LC3 and HA-M2 or HA-NP. After 24 h, cells were fixed and stained with anti-HA antibody and then visualized by confocal microscopy. In the zoomed images, yellow spots indicate the merging of M2 or NP with LC3 puncta. The image is representative of 20 cells. Scale bar, 10 μm. (C) HEK 293T cells were transfected with the indicated plasmids for 24 h, and cells lysates were collected for Western blot analysis. (D) HEK 293T cells were transfected with the indicated plasmids for 24 h. Cell lysates were immunoprecipitated with anti-HA antibody and then analyzed by Western blotting. (E) Lysates of HM/06-infected A549 cells were prepared, immunoprecipitated with the anti-NP antibody or control IgG, and then subjected to Western blot analysis. An asterisk next to the blot indicates the protein, the triangle indicates the heavy chain. Results are representative of three independent experiments. WCL, whole-cell lysate; IP, immunoprecipitation; IB, immunoblotting; DAPI, 4′,6′-diamidino-2-phenylindole.

