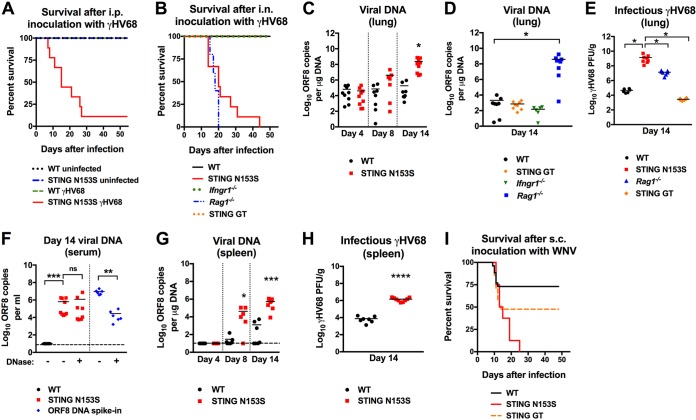
FIG 1.
STING N153S mice are highly vulnerable to viral infections. (A) Kaplan-Meier curve showing 60-day mortality of 25- to 30 week-old STING N153S mice and WT littermates following intraperitoneal inoculation with 106 PFU of γHV68 or PBS (uninfected). Shown are results for 7 to 13 mice per genotype pooled from 3 independent experiments. (B) Kaplan-Meier curve showing mortality rates of 7- to-8-week-old STING N153S, WT littermate, Ifngr1–/–, Rag1–/–, and STING goldenticket (GT) mice that were inoculated intranasally with 2 × 10⁵ PFU of γHV68. Survival was assessed for 60 days after infection. Shown are results for 8 (WT), 9 (STING N153S), 16 (Ifngr1–/–), and 5 (Rag1–/–) mice pooled from at least 2 independent experiments. (C) Viral burdens in the lung on days 4, 8, and 14 after intranasal inoculation of STING N153S mice and WT littermates with 2 × 10⁵ PFU of γHV68. Shown are results for 7 to 9 mice per genotype at each time point from 3 independent experiments. (D) Viral burdens in WT, STING GT, Ifngr1–/–, and Rag1–/– mouse lungs at day 14 after intranasal inoculation with 2 × 10⁵ PFU of γHV68. Shown are results for 8 mice per genotype pooled from at least 2 independent experiments. (E) PFU of γHV68 in the lungs of WT, STING N153S, Rag1–/–, and STING GT animals 14 days after infection with γHV68. Shown are results for 6 to 8 mice per genotype. Data were pooled from at least 2 independent experiments. (F) γHV68 viral burdens in the serum on day 14 after intranasal inoculation of STING N153S mice and WT littermates with 2 × 10⁵ PFU of γHV68. Shown are results for 8 to 9 mice per group, pooled from two independent experiments. The dashed line denotes the limit of sensitivity of the assay. (G) Viral burdens in the spleen on days 4, 8, and 14 after intranasal inoculation of STING N153S mice and WT littermates with 2 × 10⁵ PFU of γHV68. Shown are results for 7 to 9 animals per genotype, pooled from at least 2 independent experiments. The dashed line denotes the limit of sensitivity of the assay. (H) PFU of γHV68 in the spleens of WT and STING N153S mice 14 days after infection with γHV68. Shown are results for 7 to 9 mice per genotype, pooled from at least 2 independent experiments. (I) Kaplan-Meier curve showing mortality rates of 7-to-8 week-old STING N153S, WT littermate, and STING GT mice after subcutaneous inoculation with 102 FFU of WNV. Shown are results for 14 (WT), 8 (STING N153S), and 21 (STING GT) mice. Kaplan-Meier curves (A, B, and I) were analyzed by the log rank test. The data in other panels were analyzed by the unpaired t test (C and H), Kruskal-Wallis test (D), one-way ANOVA (E), or Mann-Whitney test (F and G). All data represent the means ± standard errors of the means of results from at least 2 independent experiments. *, P < 0.05; **, P < 0.01; ***, P < 0.001; ****, P < 0.0001; ns, not significant.

