FIG 4.
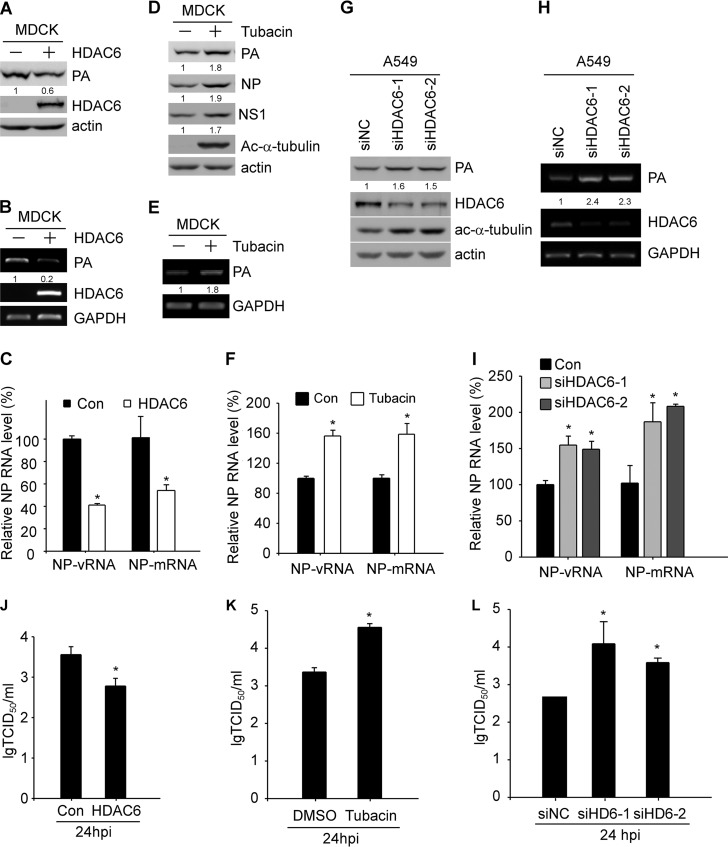
HDAC6 regulates IAV RNA transcription and replication. (A) MDCK cells were transfected with HDAC6 or empty vector for 36 h, followed by WSN infection (MOI = 2) for 3 h. PA, HDAC6, and actin were detected by immunoblotting. (B) The experiment was performed as for panel A except that the samples were collected for RNA purification. PA, HDAC6, and GAPDH mRNAs were detected by RT-PCR. (C) The experiment was performed as for panel B, and NP mRNA and vRNA levels were quantified by Q-RT-PCR. Con, control. (D) MDCK cells were pretreated with tubacin (1 μM) for 2 h and subsequently infected with WSN (MOI = 2) for 3 h. The cell lysates were prepared for immunoblotting to detect PA, NP, Ac-α-tubulin, and actin. (E) The levels of PA and GAPDH were detected by RT-PCR using RNA purified from samples as for panel D. (F) The experiment was performed as for panel E, except that cells were collected for RNA extraction. The levels of transcripts for PA, HDAC6, and GAPDH were measured by RT-PCR. (G) A549 cells were transfected with nontargeting scrambled siRNA or targeting HDAC6 siRNA for 48 h, followed by virus infection (WSN; MOI = 2) for 3 h. The viral proteins PA, HDAC6, Ac-α-tubulin, and actin were detected by immunoblotting. (H) The experiment was performed as for panel E, and NP mRNA and vRNA levels were quantified by Q-RT-PCR. (I) The experiment was performed as for panel H, except that the levels of NP mRNA and vRNA were quantified by Q-RT-PCR. (J) MDCK cells were transfected with HDAC6 or empty vector for 24 h, followed by WSN infection (MOI = 0.1) for 24 h. The supernatants were titrated in MDCK cells. (K) MDCK cells were pretreated with tubacin (1 μM) for 2 h, followed by WSN infection (MOI = 0.1) for 24 h. The supernatants were titrated in MDCK cells. (L) A549 cells were transfected with nontargeting scrambled siRNA or targeting HDAC6 siRNA for 48 h, followed by virus infection (MOI = 0.1) for 24 h. The supernatants were titrated in MDCK cells. Student's t test was used for statistical analysis. A P value of less than 0.05 was considered statistically significant (*, P < 0.05). The error bars indicate standard deviation from three independent experiments.

