FIG 1.
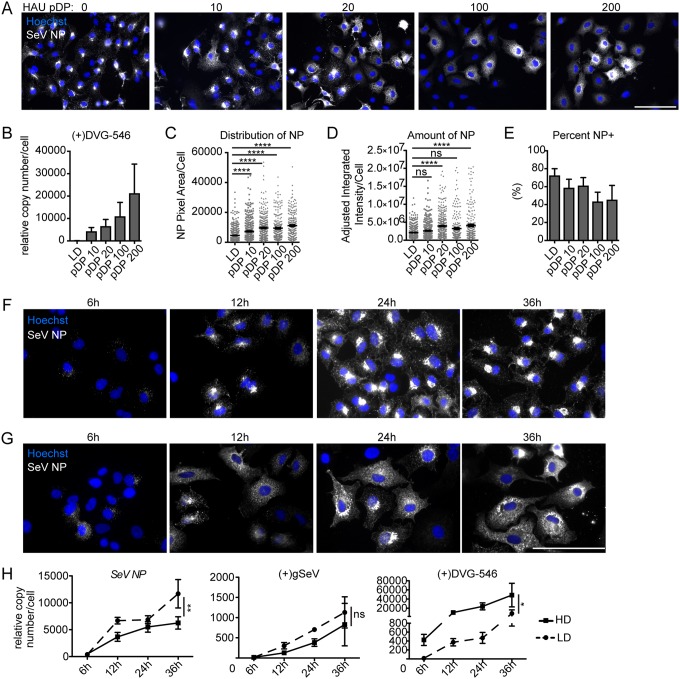
Defective viral genomes alter viral nucleoprotein distribution within infected cells. (A) A549 cells infected with SeV-LD at an MOI of 1.5 TCID50/cell supplemented with purified DPs (pDP) at the indicated HAU for 24 h and stained for SeV NP (gray). Wide-field images were captured with a 40× objective. Images are representative of results from 3 independent experiments. Bar = 100 μm. (B) RT-qPCR of SeV (+)DVG-546 relative to GAPDH. (C) Distribution of NP by pixel area within individual cells at 24 h postinfection. (D and E) Quantification of SeV NP amounts by fluorescence intensity (D) and percentage of cells per field that are NP positive (NP+) as determined by the level of fluorescence above the background (E). Results show the sum of data from 3 independent experiments with >250 individual cells analyzed under each condition. Individual cells are plotted with a line at the mean, and error bars represent standard errors of the means (SEM). ****, P < 0.0001 by a Kruskal-Wallis test with Dunn’s multiple-comparison test. ns, not significant. (F and G) A549 cells infected with SeV-LD (F) and SeV-HD (G) for the indicated times and stained for SeV NP (gray). Wide-field images were captured with a 63× objective. Images are representative of data from four independent experiments. Bar = 100 μm. (H) RT-qPCR for SeV NP, (+)gSeV, and (+)DVG-546 relative to GAPDH. Data are represented as means ± SEM from three independent experiments, **, P < 0.005; *, P < 0.05 by two-way analysis of variance (ANOVA), with significance indicated between viral infections.

