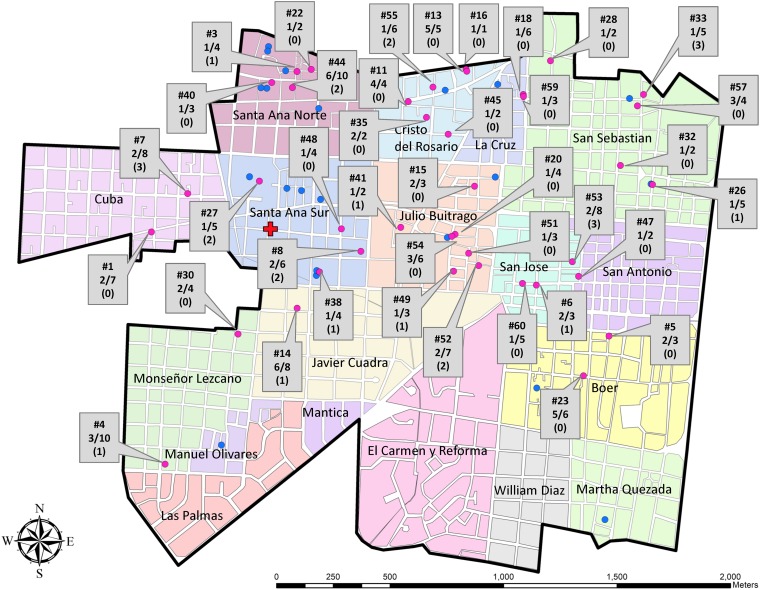
FIG 1.
Geographic distribution in District II of Managua, Nicaragua, of laboratory-confirmed CHIKV infections per household in the study. The blocks corresponding to each neighborhood within the study site are colored and labeled. The study health center is indicated by a red cross. Participating homes that did not experience an infection among at-risk individuals are shown in blue, and homes with infections among at-risk individuals are shown in pink. The box label by each home with an infection indicates, in descending order, the house number (e.g., #7); the proportion of recent, active, and incident infections out of the total number of contacts (e.g., 2/8); and the number of previous infections in that household (e.g., 0). The households’ longitude and latitude values have been jittered to protect participants’ confidentiality.

