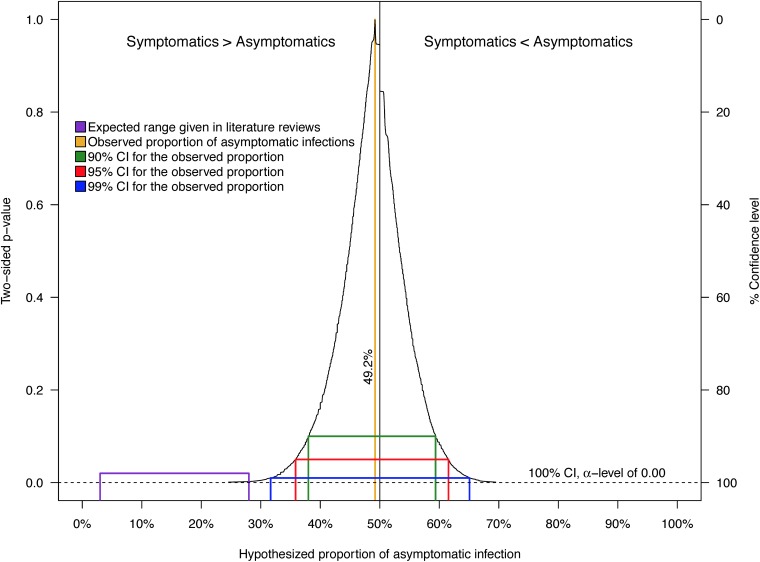
FIG 5.
Confidence interval function for the proportion of infections based on the 63 household contacts with active and incident CHIKV infections. Shown is a simultaneous depiction of 1,000 bias-corrected and accelerated (BCa) confidence intervals (CIs) as well as every two-sided P value associated with null values for hypothetical proportions of infection, given the data, across the full range of α values. For the CI function, values closer to the point estimate of 49.2% are more compatible with the data than those further away. The purple line represents the range for the proportion of inapparent CHIKV infections (3 to 28%) commonly reported in literature reviews.

