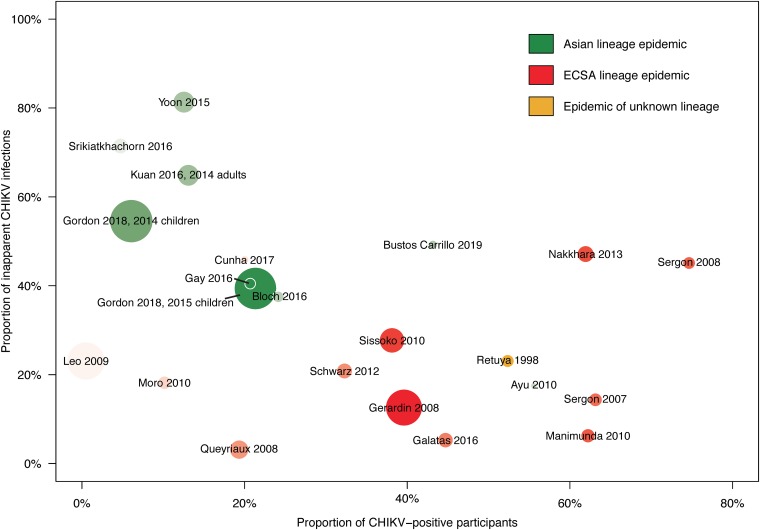
FIG 7.
Risk of CHIKV infection and inapparent clinical presentation in the literature. Scatterplot elements correspond to data in Table 4 (10, 14, 20–27, 30, 31, 85–92). The radius of each study’s data point is scaled to the sample size, and the circle is shaded to the size of the CHIKV-infected population (adapted from reference 93 with permission). Data from the present study are included for visual comparison with previously published studies.

