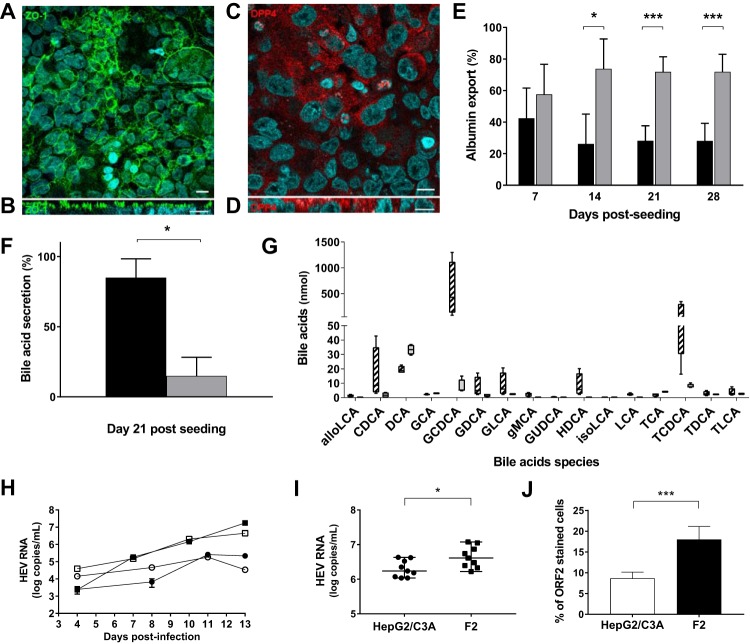
FIG 1.
Polarization of HepG2/C3A subclone F2 cells on semipermeable collagen inserts. (A to D) Immunostaining of F2 cells on semipermeable collagen inserts. Nuclei were stained with DAPI (4′,6-diamidino-2-phenylindole). Bar =10 μm. (A and B) Maximum-intensity projections of x-y stacks (A) and x-z sections (B) for the tight-junction protein ZO-1. (C and D) x-y (C) and x-z (D) sections for DPP4. (E) Percentages of albumin exported from F2 cells. The albumin in the apical (black bars) and basolateral (gray bars) supernatants was quantified by ELISA. The data shown are means and standard deviations (SD) (n = 12) of the results of four experiments performed in triplicate. *, P < 0.05; ***, P < 0.001. (F) Total bile acids from 21-day cultures of F2 cells quantified by LC-MS. The results are expressed as percentages of exported bile acids in the apical (black bars) and basolateral (gray bars) supernatants. The data shown are means and SD (n = 4). *, P < 0.05. (G) Bile acids were quantified by LC-MS on day 21 postseeding. The amounts of each detected species in the apical (hatched bars) and basolateral (gray bar) supernatants are shown (n = 4). The bile acids quantified were allolithocholic acid (alloLCA), alpha-muricholic acid (aMCA), beta-muricholic acid (bMCA), cholic acid (CA), 3-sulfo-cholic acid (CA-3S), chenodeoxycholic acid (CDCA), 3-sulfo-cheno deoxycholic acid (CDCA-3S), deoxycholic acid (DCA), glycocholic acid (GCA), glycochenodeoxycholic acid (GCDCA), glycodeoxycholic acid (GDCA), glycolithocholic acid (GLCA), gamma-muricholic acid (gMCA), glycoursodeoxycholic acid (GUDCA), hyodeoxycholic acid (HDCA), isodeoxycholic acid (isoDCA), isolithocholic acid (isoLCA), lithocholic acid (LCA), tauroalfamuricholic acid (TaMCA), taurobetamuricholic acid (TbMCA), taurocholic acid (TCA), taurochenodeoxycholic acid (TCDCA), taurodeoxycholic acid (TDCA), taurolithocholic acid (TLCA), 3-sulfotaurolithocholic acid (TLCA-3S), ursodeoxycholic acid (UDCA), and omega muricholic acid (wMCA). For clarity, only detected bile acids are shown. (H) HepG2/C3A (circles) and F2 (squares) cells were infected with nHEV genotype 3 (1.35 × 10⁶ HEV RNA copies/106 cells; white symbols) or eHEV genotype 3 (3.3 × 10⁶ HEV RNA copies/106 cells; black symbols). Supernatants were collected every 2 days, and HEV RNA was quantified by RT-PCR. (I) HepG2/C3A (circles) and F2 (squares) cells were infected with eHEV genotype 3 (2.5 × 10⁸ HEV RNA copies/106 cells). Supernatants were collected on day 15 postinfection, and HEV RNA was quantified by RT-PCR. The data shown are from three independent experiments performed in triplicate. The horizontal bars represent medians. *, P < 0.05. (J) Immunofluorescence of ORF2 protein in HepG2/C3A (white bars) and F2 (black bars) cells 21 to 30 days postinfection. Nuclei were stained with DAPI. The results are expressed as percentages of cells containing ORF2. The data shown are means and SD of the results of three independent experiments. ***, P < 0.001.

