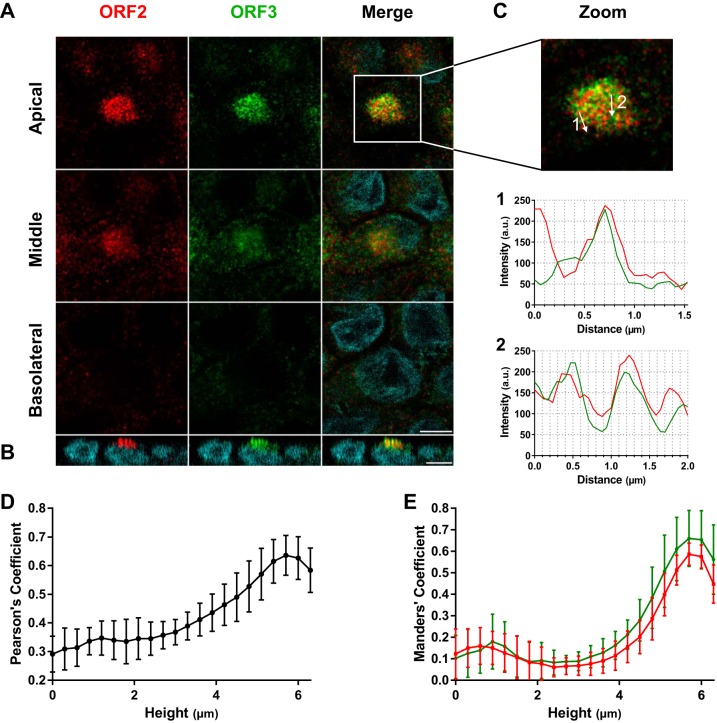
FIG 5.
Accumulation of ORF2 and ORF3 proteins at the apical sides of hepatocytes. (A and B) Immunostaining of ORF2 (red) and ORF3 (green) proteins from F2 cells grown for 14 days on inserts, infected with HEV genotype 3, and sampled 14 days postinfection. (A) Z stack of x-y sections of cells acquired by confocal microscopy and three (apical, middle, and basolateral) z sections. Scale bar = 10 μm. (B) x-z section of the cells stained for panel A. Nuclei (cyan) were stained with DAPI. Scale bar = 10 μm. (C) Paths (arrows) of the 2-pixel-wide line scans shown in graphs 1 and 2 below. (D and E) Stacks of 22 (x-y) sections were acquired, slices were separated, and Pearson’s (D) or Manders (E) coefficients were calculated on each section. The mean proportions of ORF2 intensities in ORF3 (red) and of ORF3 intensities in ORF2 (green) are shown. The error bars represent SD; n = 10.

