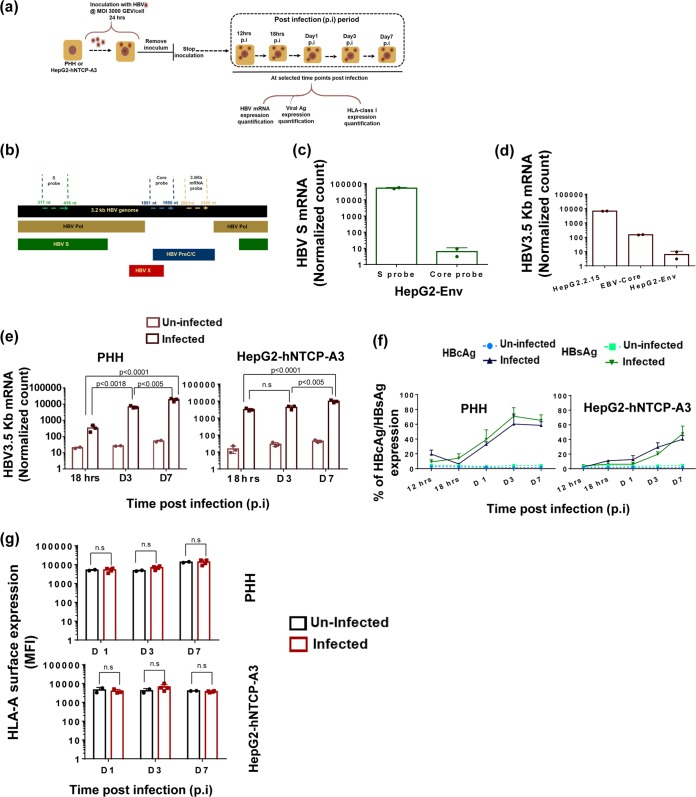
FIG 2.
Establishment of in vitro HBV infection in PHH and HepG2-hNTCP-A3 cells. (a) Schematic representation of the experimental procedure utilized to infect HepG2-hNTCP-A3 cells and PHH. Cells were inoculated at a multiplicity of infection of 3,000 GEV/cell for 24 h. Cells were utilized for virological and immunological assays at the indicated times after removal of the inoculum (time 0) referred to as time postinfection. (b) NanoString probes specific to HBV 3.5-kb mRNA (pgRNA), HBV large S, and HBV core mRNA were designed. The map represents the regions on the HBV genome which are covered by each probe. (c and d) Probe specificities were tested in cells with overexpression of individual HBV proteins or full HBV DNA integration, as indicated (Table 2). Bars show normalized counts for the indicated mRNA obtained by NanoString technology in each cell line. The highest count in each cell line belongs to the probe more specific to the region of the HBV protein which the different cell lines are overexpressing. (c) HepG2-Env cell lines shows higher counts for the probe specific to a region of large S. (d) Highest counts of the probe specific to HBV 3.5-kb mRNA (pgRNA) was observed in HepG2.2.15 cells, which have active HBV replication. (e) HBV 3.5-kb mRNA expression in PHH and HepG2-hNTCP-A3 infected cells at the indicated durations of infection (D, days). Bars represent the normalized counts of HBV 3.5-kb mRNA (pgRNA) obtained using NanoString technology. The indicated P values represent the significant increase of viral replication over the time of infection (mean of 3 replicates). (f) Frequency of HBV-infected or uninfected cells in PHH and HepG2-hNTCP-A3 cells. Cells expressing HBcAg (blue) or HBsAg (green) at 12 and 18 h and at days 1, 3, and 7 postinfection are measured with anti-HBs- and anti-HBc-specific antibodies by flow cytometry analysis. A gradual increase in the frequency of HBcAg/HBsAg-positive cells is observed in both PHH and HepG2-hNTCP-A3 cells over infection time. (g) HLA-class I surface expression in HBV-infected PHH and HepG2-hNTCP-A3 cells measured using flow cytometry. The surface expression of HLA class I is compared to that of uninfected target cells over time (days 1 to 7).

