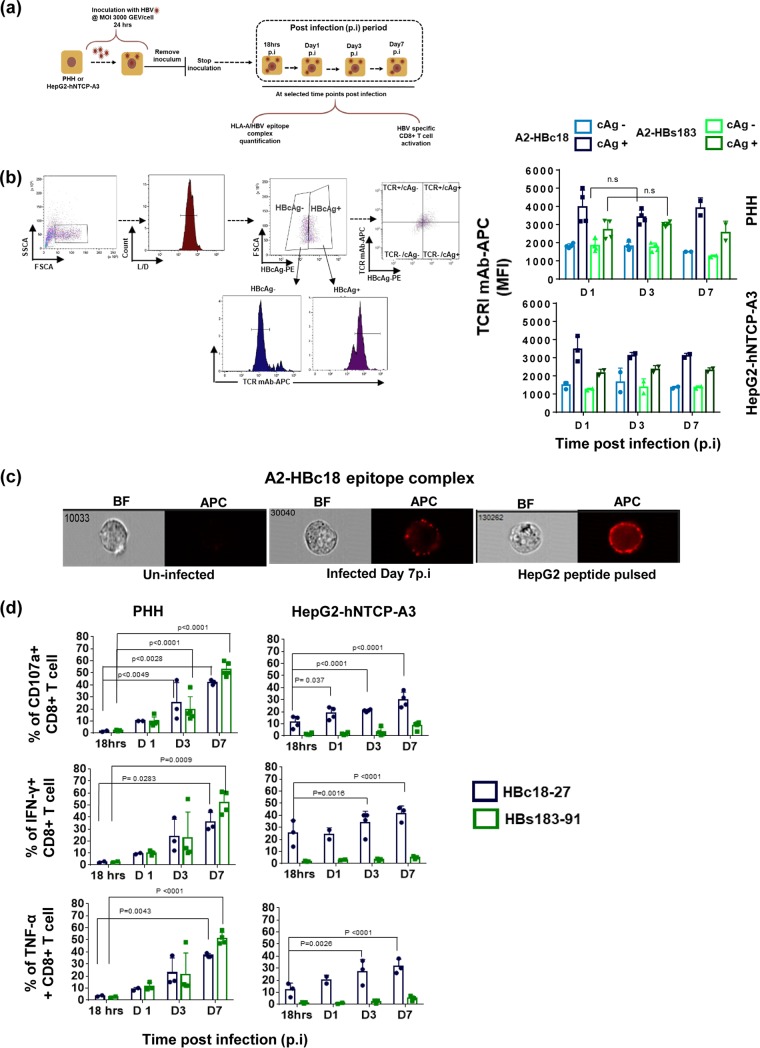
FIG 3.
HLA/HBV epitope complex presentation on HBV-infected PHH and HepG2-hNTCP-A3 cells. (a) Schematic representation of HBV-infected PHH or HepG2-hNTCP-A3 cells utilized for immunological assays. (b) Quantity of HLA-A*02:01/HBV epitope complexes on the HBcAg-negative and -positive HBV-infected cells was measured using two TCR-like mAbs, A2-HBc18 and A2-HBs183, by flow cytometry analysis. The gating strategy is shown at left. Histograms display representative MFI values of TCR-like antibodies measured on gated cells positive or negative for HBcAg staining (using anti-HBc antibody) (L/D, Live/dead). The representative dot plot on the right shows the staining profile of a population positive for both HBcAg (x axis) and TCR-like mAb (y axis). On the right, bars show MFI values of A2-HBc18 and A2-HBs183 on HBcAg+ cells in comparison with the HBcAg− population in both PHH and HepG2-hNTCP-A3 infected cells. Dots represents individual experiments. At least two replicates for indicated time points were performed. SSCA, side scatter, area; FSCA, forward scatter, area. (c) The surface distribution of A2-HBc18 is shown on HepG2-hNTCP-A3 cells infected at 7 days postinfection in comparison with HepG2 cells pulsed with 1 μg/ml of HBc18-27 peptide, using ImageStream analyzer. Representative images of cells show clustered distribution of complexes on infected targets and peptide-pulsed cells. Uninfected cells show negative background staining. BF, bright field; APC, allophycocyanin (fluorescent field). (d) Ability of HBc18-27- and HBs183-91-specific CD8+ T cells to recognize PHH and HepG2-hNTCP-A3 cells infected with HBV for the indicated times. Bars show the frequency of CD107a-expressing CD8+ T cells and activated IFN-γ- or TNF-α-positive CD8+ T cells among total CD8+ T cells after being cocultured for 5 h at an E/T ratio of 1:2. All data shown are the means ± standard deviations of at least three independent experiments.

