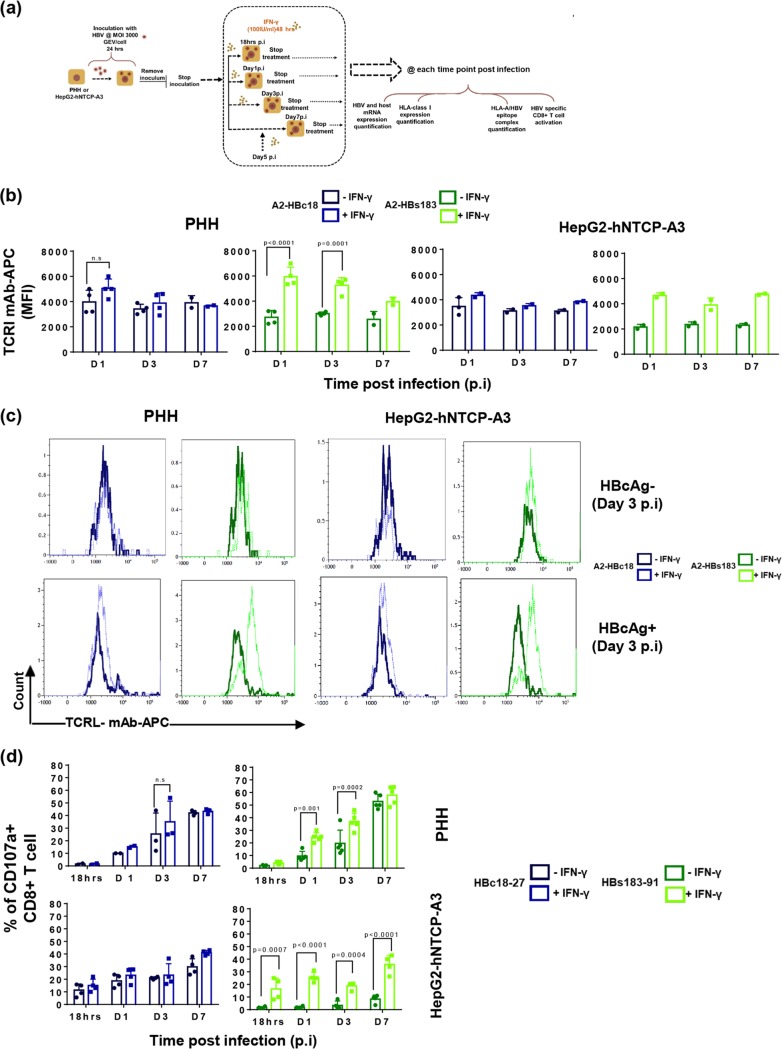
FIG 4.
The effect of IFN-γ on HBV-epitope presentation. (a) Schematic of experimental procedure of IFN-γ pulsing (100 IU/ml, 48 hours) of HBV-infected HepG2-hNTCP-A3 cells and PHH. (b) Direct quantification of HLA-class I/HBV epitope complexes with Abs specific for A2-HBc18 and A2-HBs183 complexes in HBV-infected PHH or HepG2-hNTCP-A3 cells with or without IFN-γ. Bars show MFI values of HBcAg+ populations in untreated infected cells (dark shades) compared with the population in IFN-γ treated cells (bright shades). (c) Representative histogram plots of day 3 postinfection showing MFI values of A2-HBc18 and A2-HBs183 complexes on cell surface of HBcAg− and HBcAg+ cells in infected PHH or HepG2-hNTCP-A3 cells. In each histogram the MFI value of the TCR-like mAb is shown in the presence (dotted lines) or absence (solid lines) of IFN-γ treatment. (d) Ability of CD8+ T cells specific for HBc18-27 and HBs183-91 to recognize infected PHH or HepG2-hNTCP-A3 cells for the indicated duration, with (bright shades) or without (dark shade) IFN-γ treatment (100 IU/ml, 48 h). Bars represent frequency of CD8+ T cells expressing CD107a among total CD8+ T cells cocultured with PHH and HepG2-hNTCP-A3 cells for 5 h at an E/T ratio of 1:2. All data shown are the means ± standard deviations of at least three independent experiments.

