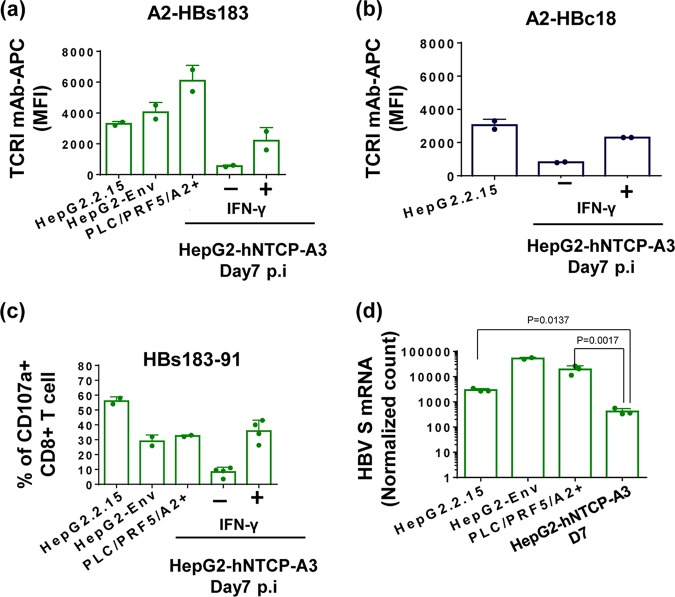
FIG 6.
Superior HBV CD8+ T cell epitope presentation on targets producing HBV antigens from HBV DNA integration. (a) Direct quantification of A2-HBs183 complexes on the surface of hepatoma cells with HBV DNA integration (HepG2.2.15, HepG2-Env, and PLC/PRF5-A2+) in comparison with infected HepG2-hNTCP-A3 cells at day 7 postinfection, treated or untreated with IFN-γ. Cells were stained with A2-HBs183 antibody as indicated previously. Bars show MFI value of the indicated antibody measured by an ImageStream analyzer. (b) Bars show MFI values of A2-HBc18 complexes on the surface of cells with full HBV genome integration, HepG2.2.15 cells, in comparison with infected HepG2-hNTCP-A3 cells at day 7 postinfection in the presence or absence of IFN-γ. MFI values were measured using an ImageStream analyzer. (c) Ability of HBs183-91-specific CD8+ T cells to recognize target cells with HBV DNA integration (HepG2.2.15, HepG2-Env, and PLC/PRF5-A2+) and HBV-infected HepG2-hNTCP-A3 cells (day 7 postinfection with or without IFN-γ treatment). Bars represent activation of CD8+ T cells measured through CD107a expression. (d) Expression of HBV large S mRNA was quantified on target cells with HBV DNA integration (HepG2.2.15, HepG2-Env, and PLC/PRF5-A2+). Bars represent the numeric normalized count of mRNA measured by NanoString technology. These values are compared to similar quantifications in HBV-infected HepG2-hNTCP-A3 target cells at day 7 postinfection.

